Check out the updated Build your own budget interactive analysis tool for a more comprehensive view of overall impacts.
The interactive analysis tool allows users to test various policy and parameter changes to see the impact on the Australian Government budget.
The modelling in Build your own budget underpins the projections and analysis contained in Beyond the budget, and users can replicate the scenario analysis contained in Beyond the budget for a more comprehensive view of overall impacts.
Overview
Beyond the budget 2024-25: Fiscal outlook and sustainability presents the 9th edition of the Parliamentary Budget Office’s (PBO’s) independent projections for the Australian Government’s fiscal position across the medium term (2028-29 to 2034-35). It also updates our analysis of long-term fiscal sustainability to 2067-68.
For most of our long-term fiscal scenarios the debt-to-Gross Domestic Product (GDP) ratio declines. This indicates that the budget remains sustainable if governments continue to take appropriate management action consistent with what has historically been done.
This does not diminish the challenge of decision making. For revenue, there is a significant risk of a continued and increasing reliance on personal income taxes. As bracket creep has been operating as a primary mechanism for budget repair, future governments may not be able to provide personal income tax cuts as regularly as in the past. A faster-than-expected decline in excise, partly due to the impact of the take up of electric vehicles on fuel excise, will also present challenges to revenue.
On the expense side of the budget, structural risks, such as the impact of ageing on health, disability programs, defence, and climate change, remain key sources of fiscal pressure.
If future government decisions simply mirror those made over recent decades, particularly in infrastructure spending, other grants and government operational costs, future spending will be higher than forecast in the budget.
Taken together, if personal income tax cuts were provided consistently (even if they did not fully compensate for bracket creep), while spending on grants and operating costs continued in line with recent historical trends, the budget would remain in deficit throughout the medium term and beyond.
Data for all charts and tables in this report are also available from our Data portal. If you find this report useful or have suggestions for improvement, please provide feedback to feedback@pbo.gov.au.
1 How to read this report
Beyond the budget 2024-25: Fiscal outlook and sustainability presents the PBO’s independent projections for the Australian Government’s balance sheet, major fiscal aggregates, and revenue and expense categories. It also includes our assessment of the budget’s long-term fiscal sustainability to 2067-68.
The PBO’s legislation requires us to use the fiscal forecasts, policy settings and economic assumptions presented in the Australian Government's 2024-25 Budget, published on 14 May 2024. Accordingly, the fiscal estimates shown in Beyond the budget for the 5-year ‘forward estimates’ period, 2023-24 to 2027-28, are identical to the budget. Our independently modelled fiscal projections are for the ‘medium term’, the period from 2028-29 to 2034-35 (a decade from the budget year). Our projections are based on the same economic assumptions that underpin the budget.
References throughout this report for the period to 2027-28 (the ‘forward estimates’), are based on the 2024-25 Budget, while references to the fiscal projections in the period beyond 2027-28, or the medium term, represent the PBO’s projections.
Beyond the budget aims to:
- Provide analysis of modelled trajectories of fiscal aggregates over the next decade. The PBO’s projections are generated using our Build your own budget analysis tool, for which Beyond the budget is the companion report. Our results are compared to Beyond the budget 2023-24, released in June 2023 and based on the 2023-24 Budget.
- Discuss key fiscal risks and challenges for the next decade, including through scenario analysis of how the fiscal position would alter if different assumptions were applied. The PBO’s Build your own budget tool allows you to explore alternatives to the analysis we present here by adjusting various policy and economic parameters.
- Provide medium-term fiscal projections at a greater level of detail than is available in the published budget papers, which only include total receipts and payments, the underlying cash balance (UCB), and debt aggregates. PBO projections cover each of the major taxes and expense programs to enable more forensic analysis of the factors influencing the budget.
- Present an analysis of fiscal sustainability for the period after the end of the medium term (from 2035-36 onwards). While the projections to 2034-35 relate directly to the economic projections of the 2024-25 Budget, the longer-term fiscal analysis explores the question: ‘If governments maintain budget balances that are similar to historical precedents across economic cycles, is the fiscal position likely to be sustainable across the long term?’ To answer this, we focus on potential pathways for the debt-to-GDP ratio from 2035-36 to 2067-68, based on combinations of 3 key parameters: the budget primary balance (headline cash balance (HCB) before interest payments), interest rates, and economic growth (nominal GDP).
As our framework for fiscal sustainability centres on the balance sheet, we present our medium-term outlook for the balance sheet and major aggregates first (chapter 2), followed by long-term fiscal sustainability scenarios (chapter 3). More detail on government revenue and expenses across the medium term is presented in chapters 4 and 5. Our methodology is summarised in Appendix A.
The underlying data series for all charts and tables are available in our Data portal.
Box 1: What is the Parliamentary Budget Office (PBO)?
The PBO was established in 2012 to ‘inform the Parliament by providing independent and non partisan analysis of the budget cycle, fiscal policy and the financial implications of proposals’ (Section 64B of the Parliamentary Service Act 1999). We do this in 3 main ways:
- by responding to requests made by senators and members for costings of policy proposals or for analysis of matters relating to the budget
- by publishing a report after every election that provides transparency around the fiscal impact of the election commitments of major parties
- by conducting and publishing self-initiated work that enhances the public understanding of the budget and fiscal policy settings.
For further information and an introduction to our services, see Guide to the services of the Parliamentary Budget Office (PBO).
Our interactive dashboards are best viewed on larger screens/desktops.
Interactive charts and visualisations dashboard
This dashboard provides an interactive chart or visualisation for each chart in this report. The dashboard is organised into chapters corresponding to the report’s structure.
We encourage you to explore the visualisations and interact with the data for a deeper understanding of the insights presented.
Our interactive dashboards are best viewed on larger screens/desktops.
2 Projections for the balance sheet and major fiscal aggregates
- This chapter presents our medium-term projections for the balance sheet and major fiscal aggregates, given the economic projections of the 2024-25 Budget.
- Projections for most fiscal aggregates, such as the budget balance and debt, are largely unchanged compared to a year ago.
- Gross debt is projected to fall from 33.9% of GDP in 2024-25 to 30.0% of GDP in 2034-35, despite continued budget deficits.
- Gross interest payments are projected to grow as bond yields rise, increasing from 0.9% of GDP in 2024-25 to 1.3% of GDP in 2034-35.
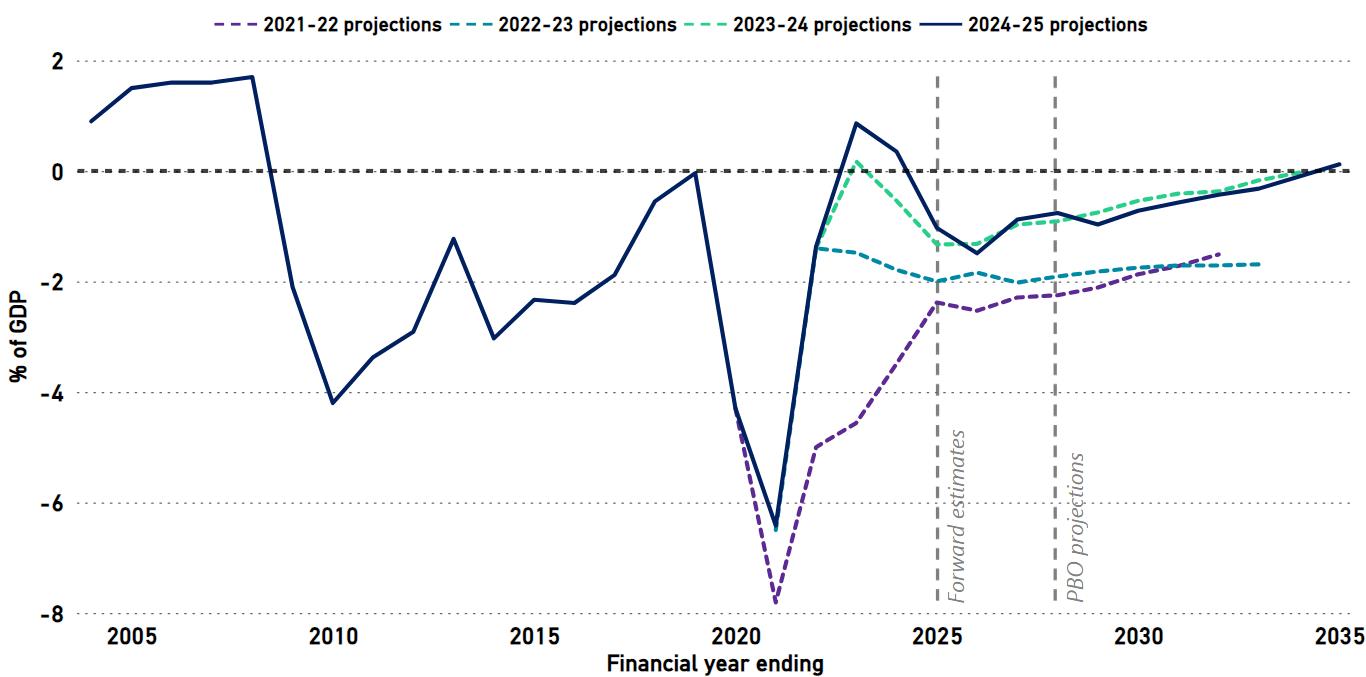
- Following the anticipated surplus in 2023-24, the UCB is projected to gradually improve from a deficit of 1.0% of GDP in 2024-25 to a surplus of 0.1% of GDP in 2034-35.
- Net financial worth is projected to improve from -27.7% of GDP in 2024-25 to -19.5% of GDP in 2034-35, reflecting projected falling debt across the medium term.
Gross debt as a share of GDP (Figure 2-1) is projected to decrease over the medium-term period, but the end point is very similar to our projection a year ago, despite lower than previously forecast debt levels in the forward estimates.
The relative stability of projections compared to a year ago contrasts with a series of improved projections over the past 3 budgets. While higher-than-assumed commodity prices and general price and wage inflation have increased projected government revenue, there have been similar sized upwards revisions to projected expenditure.
Net debt, which adjusts the value of gross debt to account for the government’s financial assets, is projected to follow a similar trajectory to gross debt and, compared to our previous projections, reach a similar level as a share of GDP by 2033-34.
Figure 2-1: Gross and net debt, 1993-94 to 2034-35

Note: 2021-22, 2022-23 and 2023-24 projections refer to the PBO’s previous Beyond the budget reports.
Source: 2021-22 Budget, 2022-23 Budget, 2023-24 Budget, 2024-25 Budget and PBO analysis.
Interest payments on Australian Government Securities are now projected to be the government’s fastest-growing major payment category between 2024-25 to 2034-35, with 9.9% average annual growth, displacing the NDIS as the fastest-growing payment in last year’s projections (9.2% average growth).1
Across the year to May 2024, the Reserve Bank of Australia (RBA) raised its cash rate target from 3.85% to 4.35%.2 Expected yields on government bonds between the 2023-24 Budget and the 2024-25 Budget also increased. The 2024-25 Budget assumed a weighted average cost of borrowing of 4.2% across the forward estimates (2024-25 to 2027-28), up from 3.4% across the 2023 24 Budget forward estimates.3
As a result, when the government issues new bonds to finance future budget deficits or refinance matured debt, it will pay a higher rate of interest than previously assumed, despite the improved budget position in 2023-24 which reduces the level of debt.
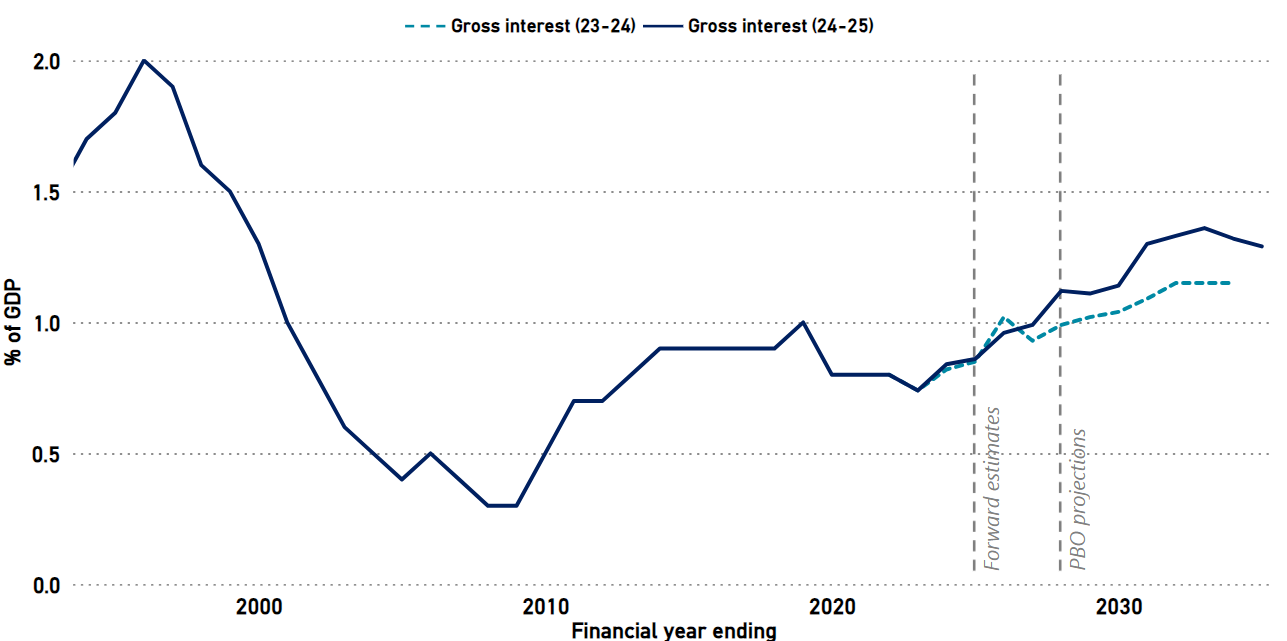
Gross interest payments are forecast to be higher by the end of the forward estimates than in the 2023-24 Budget (Figure 2-2). Over the medium term, interest payments are projected to rise higher as a share of GDP, peaking at 1.4% of GDP in 2032-33 (the highest level since 1999), before gradually declining as a result of decreasing debt.
Figure 2-2: Gross interest4, 1993-94 to 2034-35
Source: 2023-24 Budget, 2024-25 Budget, and PBO analysis.
Figure 2-3 shows the changes to bond yield projections between the 2023-24 Budget and the 2024-25 Budget. The increase in bond yields, despite slightly lower projected debt, shows why our projections for interest payments have increased relative to our 2023-24 projections.
Figure 2-3: 10-year bond yields, 2023-24 to 2034-35

Source: 2023-24 Budget, 2024-25 Budget.
Based on the budget assumption that current policy settings continue unchanged, the UCB is projected to gradually shift from a deficit which peaks at 1.5% of GDP in 2025-26 towards a surplus by the end of the medium term (Figure 2-4). These projections are largely unchanged since those of a year ago, with improvements in 2023-24 expected to be temporary.
While the UCB is mostly unchanged, there have been relatively large revisions to both government revenue and expenses due to changes to economic parameters and government policies.
Nominal GDP is now expected to be higher, owing to higher assumed commodity prices, resulting in higher forecast and projected tax revenue. These increases have been partly offset by higher interest and operational costs, as well as a range of new expenditure policy decisions (also known as ‘measures’).
In the short term, the $300 rebate for energy bills will add $3.5 billion to government expenses, and over the next decade, the National Defence Strategy and Integrated Investment Program will add over $50 billion to expenses. Other new policy decisions will also add to expenses, in both the short and long term.
More detail on revenue projections is contained in chapter 4 while more information on expenditure projections is contained in chapter 5, and more of the PBO’s reporting on the 2024-25 Budget can be found in our 2024-25 Budget Snapshot.
Figure 2-4: Underlying cash balance, 2003-04 to 2034-35
Source: 2021-22 Budget, 2022-23 Budget, 2023-24 Budget, 2024-25 Budget, and PBO analysis.
The UCB is only one of several ‘fiscal aggregates’ used to assess the government’s fiscal position. In addition to the UCB, the primary cash balance, fiscal balance, and HCB are also used (these are described in Appendix A). As each aggregate has a different focus, it can be useful to examine them together when assessing the budget position. (Figure 2-5).
- The primary cash balance, which does not account for the increasing impact of net interest payments on the cash balance5, is expected to be in deficit from 2024-25, before returning to surplus in 2030-31 and beyond.
- The fiscal balance is the accrual version of the UCB – it records revenue when it is earned and expenses when they are incurred, regardless of when any money is actually received or paid out. As timing is the main difference between the fiscal cash balance and the UCB, they tend to follow the same trajectory. We project the fiscal balance to record a slightly smaller deficit and reach surplus in 2033-34 compared to the underlying cash balance which is projected to reach surplus in 2034-35.
- Of these different budget aggregates, the HCB, which also includes financial investments for policy purposes, is projected to be in the largest deficit in all years across the medium term.
Figure 2‑5: Budget aggregates, 2021-22 to 2034-35

Source: 2024-25 Budget and PBO analysis.
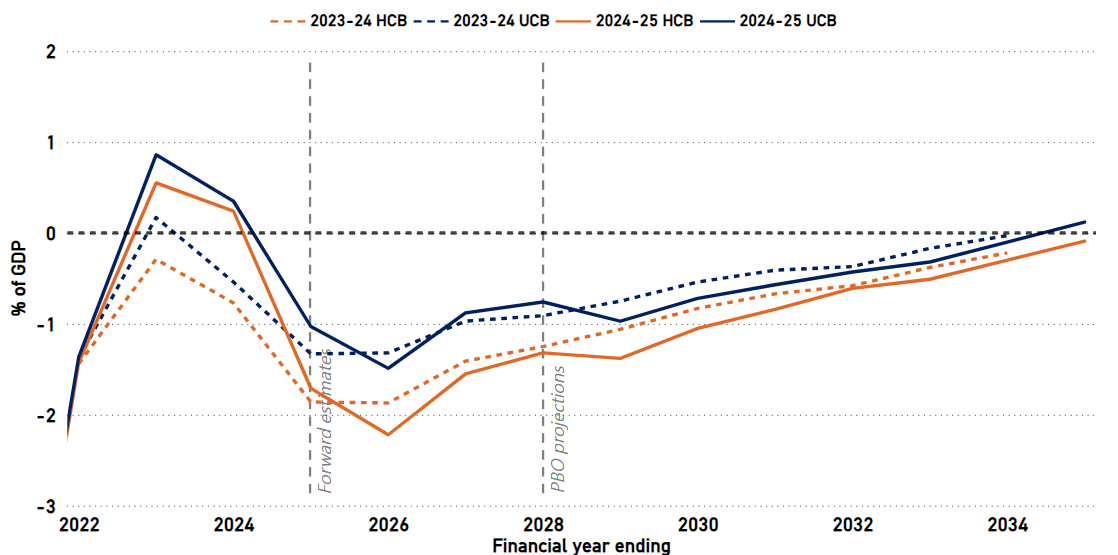
The 2024-25 Budget saw an increase in the use of what is sometimes called ‘off-budget’ financing, where spending appears in the HCB but not the UCB (Box 2). There is a difference of around $81 billion between these two balances over the forward estimates, around $21 billion more than over the 2023-24 Budget forward estimates. The widening gap is largely a result of additional Snowy Hydro investments and an increase in concessional finance for housing projects.
As a result, while the UCB is projected to return to surplus by the end of the medium term, the HCB is projected to remain marginally in deficit. Figure 2-6 compares projected UCBs and HCBs in this and last year’s projections, showing an increase in the difference between the two balances, particularly in 2025-26 and 2026-27.
Figure 2‑6: Underlying cash balance and headline cash balance, 2021-22 to 2034-35
Box 2: ‘Off-budget’ financing is on-budget (but not in the UCB)
The 2024-25 Budget’s additional funding of Snowy Hydro and concessional housing loans are the latest instances of financing programs that do not directly affect the UCB. All these transactions are, however, still part of the budget and are typically disclosed in the government’s financial statements in the Reconciliation of general government sector underlying and headline cash balance estimates table in Budget Paper No. 1.6
The term ‘off-budget financing’ is often pejorative, implying a form of accounting trickery or secrecy. In fact, government spending is always part of the budget, but the form of the spending may mean it does not contribute to the most commonly reported fiscal aggregate, the UCB. There is no single number which adequately measures the fiscal position. Instead, the budget should be assessed through a suite of variables.
The UCB only includes payments for programs where the government receives no financial asset in return. For example, the Age Pension or unemployment benefits are paid to eligible people, without them now owing anything back to the government.
The HCB includes all payments included in the UCB and adds payments for programs where the government receives a financial asset in return. An example is student loans. The government provides funding for students, but in return receives a financial asset – a loan – which will later be paid back. In this case the cash is exchanged for a loan. The government may need to borrow to provide the funding to the student, which increases gross debt, but because the government receives an asset in exchange, net debt is unaffected.
Another example is the National Broadband Network. Rather than providing a grant (which would have been recorded in both the UCB and HCB), the government provided funding to a newly created company (NBN Co) and in exchange became the sole shareholder in the company. The government exchanged cash (an ‘equity injection’) for a financial asset. This transaction appears in the HCB but not the UCB.
These additional transactions are called ‘net cash flows from investments in financial assets for policy purposes’, which together are the difference between the HCB and the UCB.
A third category of spending is when the government puts aside money in a fund for later use. In this case no money has changed hands, so the transaction does not appear in either the HCB or UCB. The transaction is to assist the government to manage its budget, not to directly deliver a policy. These transactions are called ‘cash flows for liquidity purposes’. Later, when the government spends the money out of the fund to deliver its program, the amounts will appear in the UCB.
In recent years, there have been several government policies using these financing arrangements, rather than simple direct payments. In addition to the National Broadband Network, these have included the National Reconstruction Fund, which provided loans, equity investment or guarantees for a range of industry projects; and the Home Equity Access Scheme, which enabled older Australians to access equity in their real estate holding through a government loan.
The PBO’s report Alternative financing of government policies provides more information.
3 Fiscal sustainability
- This chapter explores how the government debt could evolve under a range of assumptions and whether the fiscal position is likely to be sustainable over the long term to 2067-68.
- Our scenarios show the long-term debt-to-GDP ratio slightly lower in most scenarios compared to our analysis a year ago.
- The fiscal position is sustainable in most scenarios considered. This means that future governments should be able to keep the debt-to-GDP ratio relatively stable through interventions on a similar scale to what we have seen in the past.
- However, structural risks to the budget remain, including an ageing population and the increasing cost of health services. These risks may increase the extent to which government interventions is needed to keep the fiscal position sustainable.
Judgements about fiscal sustainability relate to the long term. In this analysis, fiscal sustainability refers to the government’s ability to maintain its long-term fiscal policy settings indefinitely without the need for major remedial policy interventions. This means that governments need to continue to act but that, in general, historical approaches to borrowing and repaying debt can be maintained, while keeping taxation and spending within reasonable and expected bounds. In contrast, the government’s Intergenerational Report projects on the basis of no future policy changes, resulting in projections that are usually more pessimistic than those presented by the PBO.
We consider the fiscal position to be sustainable if the debt to GDP ratio is expected to be stable or trend downwards over the long term. Such circumstances provide governments the fiscal space to pursue their long-term policy objectives and to support sustainable economic growth. It allows flexibility for governments to respond to changes in economic conditions, including downturns, either through automatic or discretionary mechanisms.
The long-run trajectory for the debt-to-GDP ratio is driven by 3 parameters: the budget balance (HCB before interest payments); the prior stock of debt and the interest rates that apply to this debt; and economic growth (nominal GDP).
The budget balance does not necessarily need to be zero or in surplus to reduce the debt-to-GDP ratio. If the rate of economic growth exceeds the rate of interest on debt, debt-to-GDP can be reduced with sufficiently small budget deficits. Accordingly, budget deficits can be consistent with a fiscally sustainable position.
A sustainable position also does not mean the debt-to-GDP ratio will not increase at times, especially in response to large unforeseen economic shocks, such as the COVID-19 pandemic. In this sense, it is not necessarily the level of debt that determines if the fiscal position is sustainable, but whether, on average, the debt-to-GDP ratio is expected to remain stable or to trend downwards over the long term.
By comparison, the fiscal position may not be sustainable if the debt-to-GDP ratio is expected to trend upwards over the long term. In such circumstances, more significant interventions would be needed to reduce deficits and keep debt broadly stable as a percentage of GDP.
In our fiscal sustainability analysis, we examine 27 possible scenarios for the debt-to-GDP ratio over a 40-year period. Each scenario reflects variations in 3 parameters – interest rates, economic growth, and the budget balance – consistent with low, middle, and high ranges throughout history. We refer to these variations as ‘cases’. For example, one scenario might combine our middle case for the budget balance, our best case for interest rates, and our worst case for GDP growth.
Each of our scenarios represent a possible future trajectory for the debt-to-GDP ratio, but we do not make any judgement as to which scenario is most likely. For instance, our middle scenario should not be considered as a baseline or most likely trajectory. Instead, we are illustrating what the path could be under a range of plausible economic and policy conditions.
Importantly, the overall best and worst case scenarios represent combinations of interest rates and economic growth that would be unlikely to persist for an extended period of time. For example, should economic growth slow to the rate assumed in the worst scenario, the RBA would likely respond by lowering interest rates, offsetting the impacts on the budget balance. These extreme scenarios are intended to illustrate that the budget is generally sustainable even assuming highly unlikely combinations of long-term economic growth, interest rates and budget balances.
By building our scenarios around historical averages, we have implicitly captured the impact of future economic shocks and policy changes, to the extent that these are of a similar magnitude and regularity to those of the past. However, if future economic or climate change shocks were larger or more frequent than historical shocks, or if long-term structural shifts meant that GDP growth rates were much lower than they have been historically, this would make it more difficult for Australia to maintain a fiscally sustainable position.
For more information on the framework we use to assess fiscal sustainability, see our report on Fiscal sustainability.
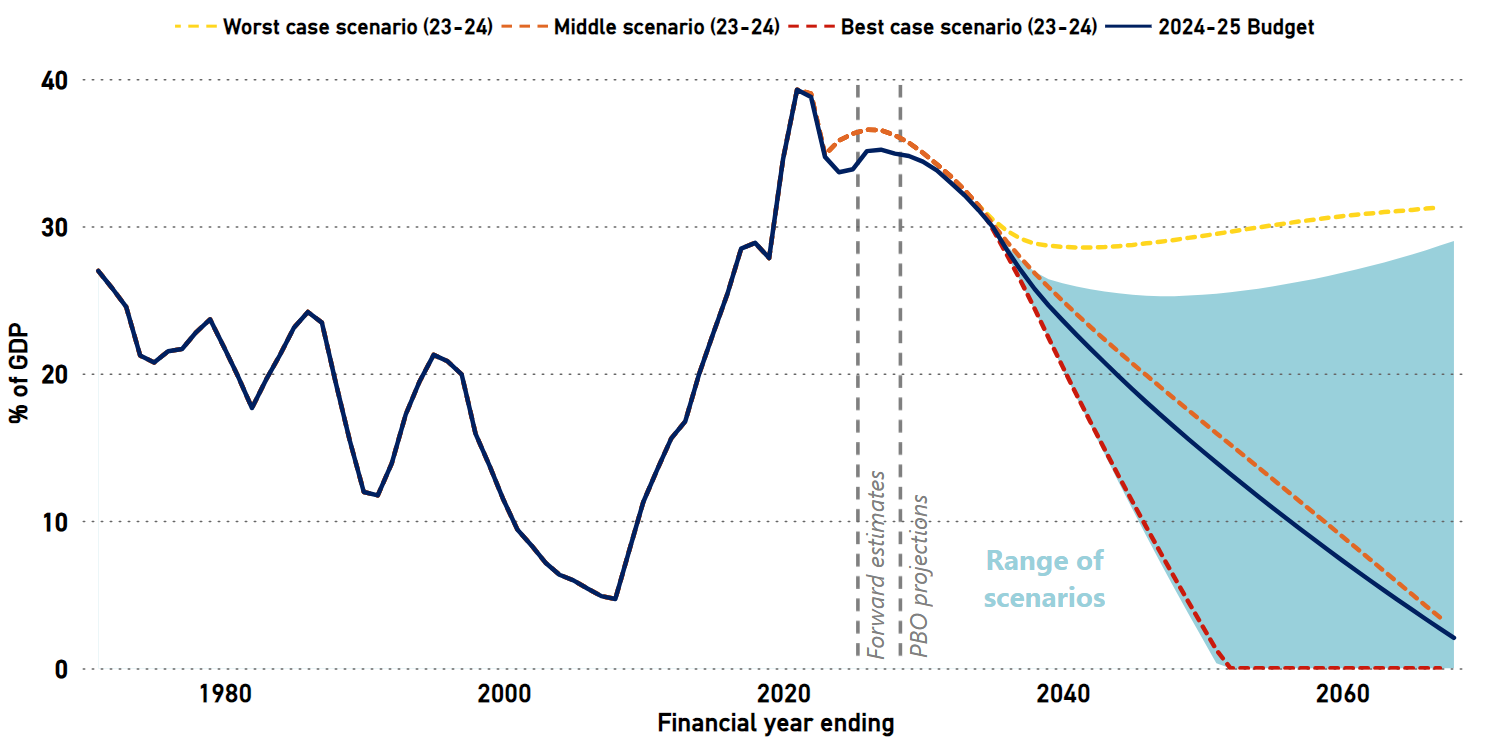
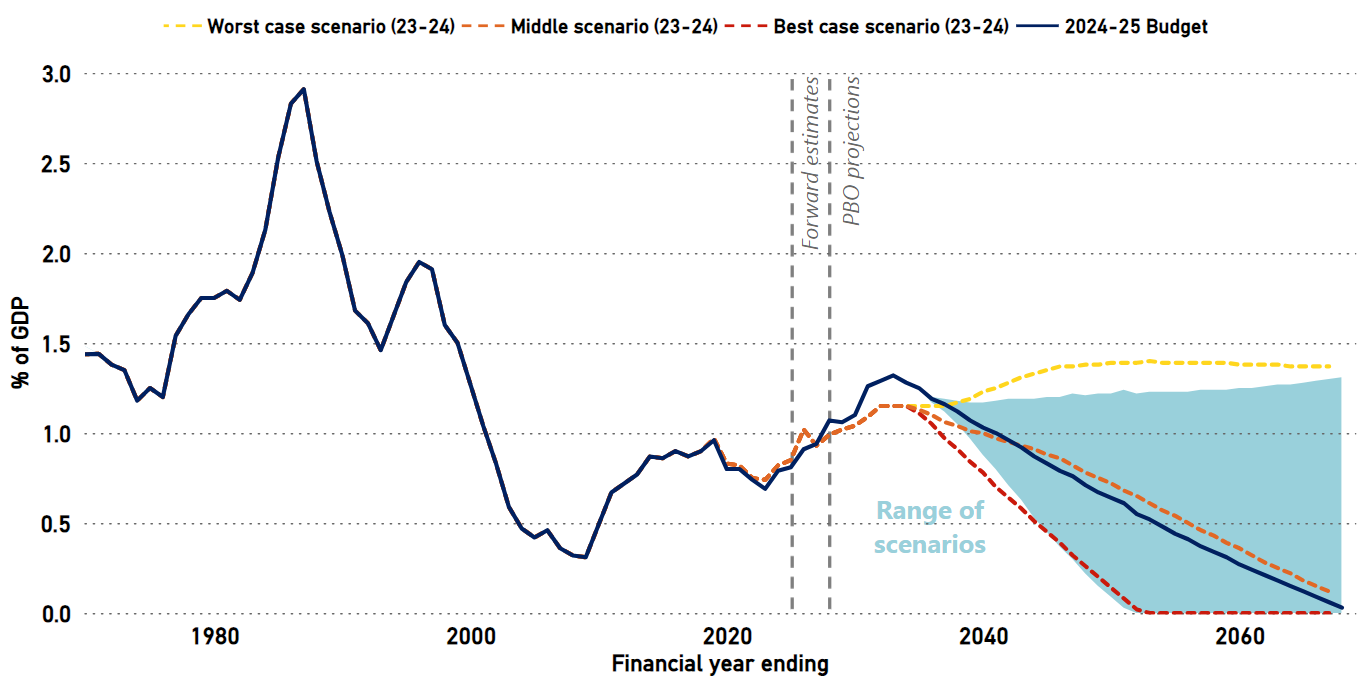
Table 3-1 shows our middle, best, and worst cases. The results of all 27 scenarios are shown in Figure 3-1. Interest payments under each scenario are shown in Figure 3-2.
Table 3-1: Cases for middle, best and worst scenarios7

In 24 of our 27 long-term scenarios, the debt-to-GDP ratio is expected to trend downwards over the long term. This suggests that the fiscal position is likely to be sustainable in all but the most extreme – and unlikely – circumstances.
Figure 3‑1: Gross debt, 1970-71 to 2067-68
Note: Dashed lines refer to PBO projections published in the 2023-24 Beyond the budget report for low, medium, and high GDP growth scenarios.
Source: 2023-24 Budget, 2024-25 Budget, and PBO analysis.
Figure 3-2: Interest payments, 1970-71 to 2067-68
Note: Dashed lines refer to PBO projections published in the 2023-24 Beyond the budget report for low, medium, and high GDP growth scenarios.
Source: 2023-24 Budget, 2024-25 Budget, and PBO analysis.
Gross debt and interest payments, as a share of GDP, are expected to decline in all but the worst-case scenarios by the end of the PBO’s analysis period. This is largely due to upwards revisions to nominal GDP growth and downwards revisions to debt as a share of GDP across the medium term, the effects of which flow through to the PBO’s analysis period. As a result, when compared to our 2023-24 analysis, the long-term debt to GDP ratio is slightly lower in best and middle case scenarios and significantly lower in worst case scenarios.
For example, in our middle scenario the debt-to-GDP ratio is projected to peak at 35.2% of GDP in 2026 27, before trending down to 2.7% by 2066-67. By comparison, the middle scenario in our 2023 24 analysis showed debt-to-GDP peaking at 36.6% of GDP in 2025-26 before declining across the remainder of the medium term to land at 3.4% of GDP 2066-67.
Australians are increasingly living longer than ever before. This trend has significant implications for policymakers seeking to ensure the care of older Australians is balanced with the fiscal risks of an older population.
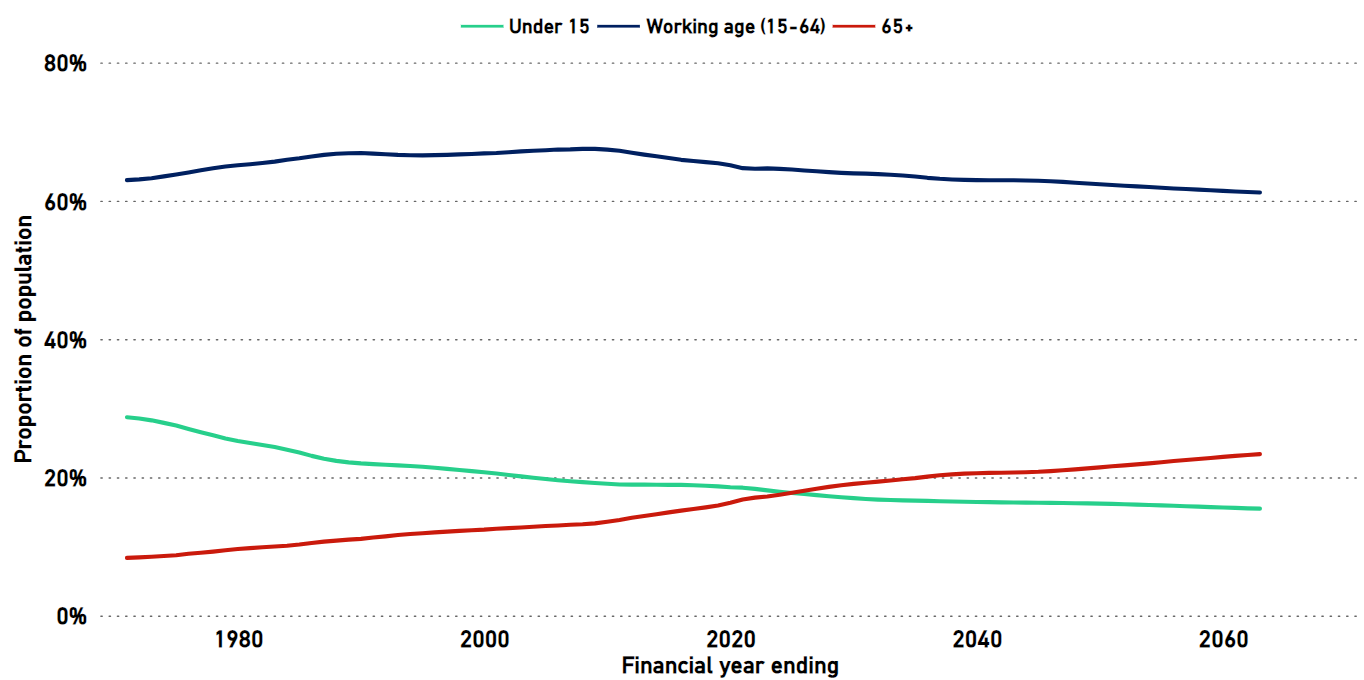
Australia is fast approaching a significant demographic milestone. On current estimates, during 2024 25 the population of Australians over 65 will exceed the population under 15, with this trend projected to continue over the coming decades (Figure 3-3). An older population will have substantial implications for the economy and for the budget balance, as the size of the labour force gradually declines relative to the total population.
Figure 3-3: Ageing population, 1970-71 to 2062-63
Source: 2023 Intergenerational Report, and PBO analysis.
Many government payments relate to children and the aged, so a net switch between the two populations will result in somewhat offsetting impacts. For example, Age Pension costs are expected to increase at a relatively faster pace (62.7% over the 10 years to 2034-35) while costs related to schools are also expected to grow, but at a slower rate (45.7% over the next 10 years).8 In net terms an ageing population places upward pressure on government expenditure and downward pressure on revenue. The 2023 Intergenerational Report projected total government spending to rise from 24.8% in 2022 23 to 28.6% of GDP by 2062–63, with around 40% of the increase attributable to the ageing population.9
In addition to the ageing population, significant investments in the aged care system in recent budgets have also increased projected aged care expenditure. Unlike many other social support packages (such as the $300 energy rebate in the 2024-25 Budget) these expenses are predominantly ongoing and impact the budget’s structural position.
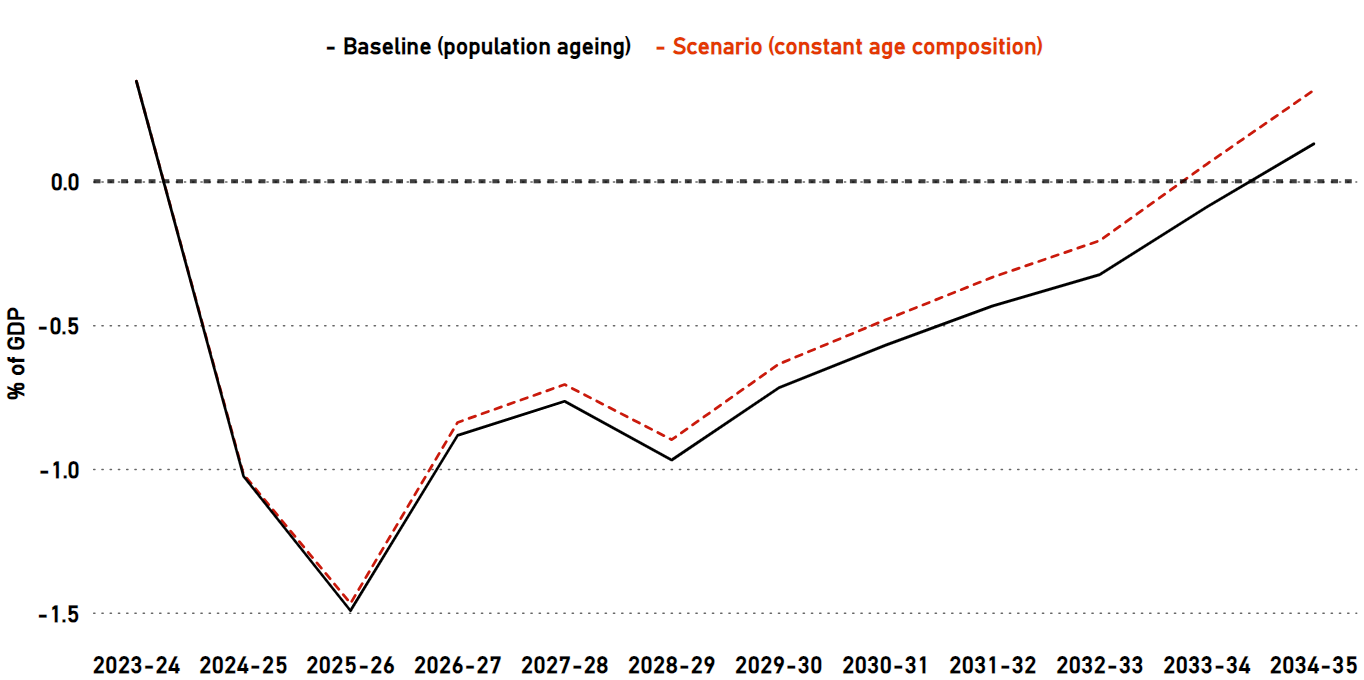
Using the PBO’s Build your own budget analysis tool, we have constructed a scenario where the age composition of the population is held constant over the next decade, rather than shifting towards older ages. In this case, economic growth and government revenue are higher and expenses are lower, with the increased expenses related to children more than offset by the decreased expenses related to supporting the aged. The net impact on the UCB is relatively small over the decade, reaching a quarter of a per cent of GDP by 2034-35 (Figure 3-4), but compounds over time, and would continue to increase over at least the next 40 years.
For further information on the budget impacts of the ageing population, see our report, Australia’s ageing population. The government’s various Intergenerational Reports also examine long-term fiscal impacts of the ageing population.
Figure 3-4: Impact of ageing population on the underlying cash balance
Source: PBO analysis using the PBO’s Build your own budget tool.
In most of the scenarios in the fiscal sustainability analysis the debt-to-GDP ratio declines in the long term, we therefore assess that the budget can remain sustainable, without interventions going beyond those that have been applied by past governments. However, implementing such interventions can be challenging.
As a result of the ageing population, the combination of the revenue loss and the increase in structural spending will continue to present challenges to governments looking to maintain the same budget balances as in the past.
There are also a range of other existing and emerging risks that will make maintaining historical budget balances difficult.
On the revenue side, continued decline of the excise base (Box 4), which will possibly accelerate, will increase even further the already high reliance on personal income tax. Future policy decisions to compensate bracket creep will come at a high fiscal cost (Box 5).
History suggests policy decisions that increase expenditure in areas such as infrastructure, grants and general government operating costs are likely to continue. The current allowances for these in the budget will likely be a significant underestimate (section 5-4).
Estimated impacts of these policy-driven factors, each discussed in detail later, are summarised in Box 3.
Increased expenditure on areas such as the National Disability Insurance Scheme (NDIS), climate and defence also pose downside risks to the budget.
Future considerations of tax reform will need to consider how to raise alternative sources of tax revenue, as well as how to target government spending to ensure the budget's resilience and sustainability.
Box 3: Relaxing the ‘no policy change’ budget assumption
The PBO projections, as with budget forecasts, assume no policy changes beyond those already announced by governments.
This report identifies 3 significant cases where policy change may occur over the decade and will have a highly significant impact on the budget: personal income tax rates and thresholds; grant expenses, particularly for road and rail infrastructure; and departmental operating costs. Using the Build your own budget tool, we can test the sensitivity of the budget to the ‘no policy change’ assumption by combining the impacts over the next decade of:
• Maintaining average personal income tax rates at the 2024-25 level by increasing tax thresholds each year (Box 5).
• Holding government grants, such as road and rail funding for the states and territories, 0.25% of GDP higher than our baseline projections from 2027-28 and beyond, with smaller increases for earlier years (see Section 5-4).
• Holding government operating costs 0.5% of GDP higher than our baseline projections from 2027-28 and beyond, with smaller increases for earlier years (see Section 5-4).
The results are presented in Figure 3-5. The scenario demonstrates that if the government provides material personal income tax relief, the projected UCB may remain in deficit indefinitely. Meanwhile, the other 2 components would provide further downside pressure, alone extending the period of a budget deficit for several years.
While our long-term fiscal sustainability scenarios are on a different time horizon, none are as severe as that shown in this box. Our long-term scenarios assume that future governments can maintain budget balances similar to those of the past. This sensitivity analysis illustrates that given the current set of budget challenges alone, this will require significant policy discipline.
Figure 3-5 Combined impact of the scenarios on the UCB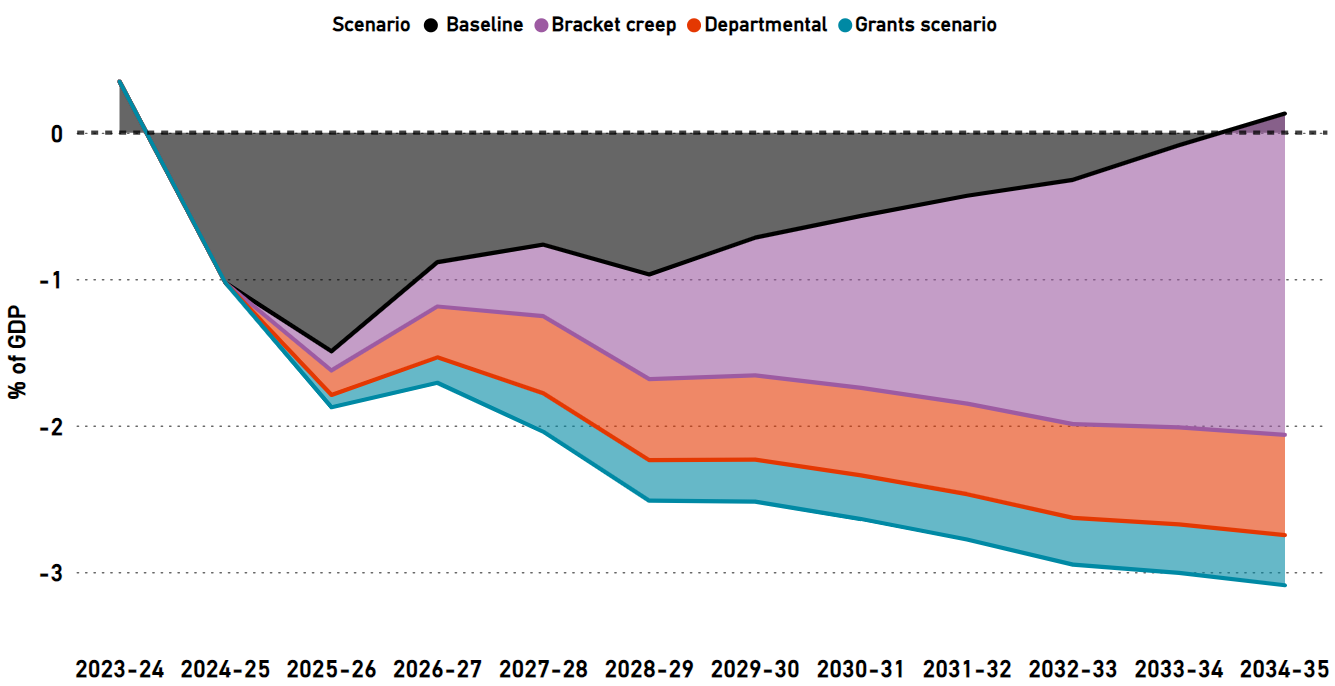
Source: PBO analysis using the PBO’s Build your own budget tool.
4 Revenue
- This chapter presents our projections for the budget’s various sources of revenue, particularly tax.
- Total revenue is projected to increase from 25.8% of GDP in 2024-25 to 26.9% of GDP in 2034 35, higher than our previous projections as a result of higher than previously projected personal income tax revenue, due to improved economic projections.
- As a result of bracket creep, the average personal income tax rate is projected to increase across the medium term to a record high of 28.2% in 2034-35, despite the implementation of the Cost of living (previously Stage 3) tax cuts.
- Company tax revenue is projected to remain broadly stable at around 4.8% of GDP from 2027-28 to 2034-35, after a forecast fall from 5.1% of GDP in the forward estimates, as commodities return to their long-run rate.
- Fuel and tobacco excise are both projected to decrease slightly from 1.0% and 0.4% of GDP in 2024-25 to 0.9% and 0.2% of GDP in 2034-35, respectively.
- Goods and services tax (GST) is projected to remain stable as a share of GDP across the medium term, as are most other revenue sources.
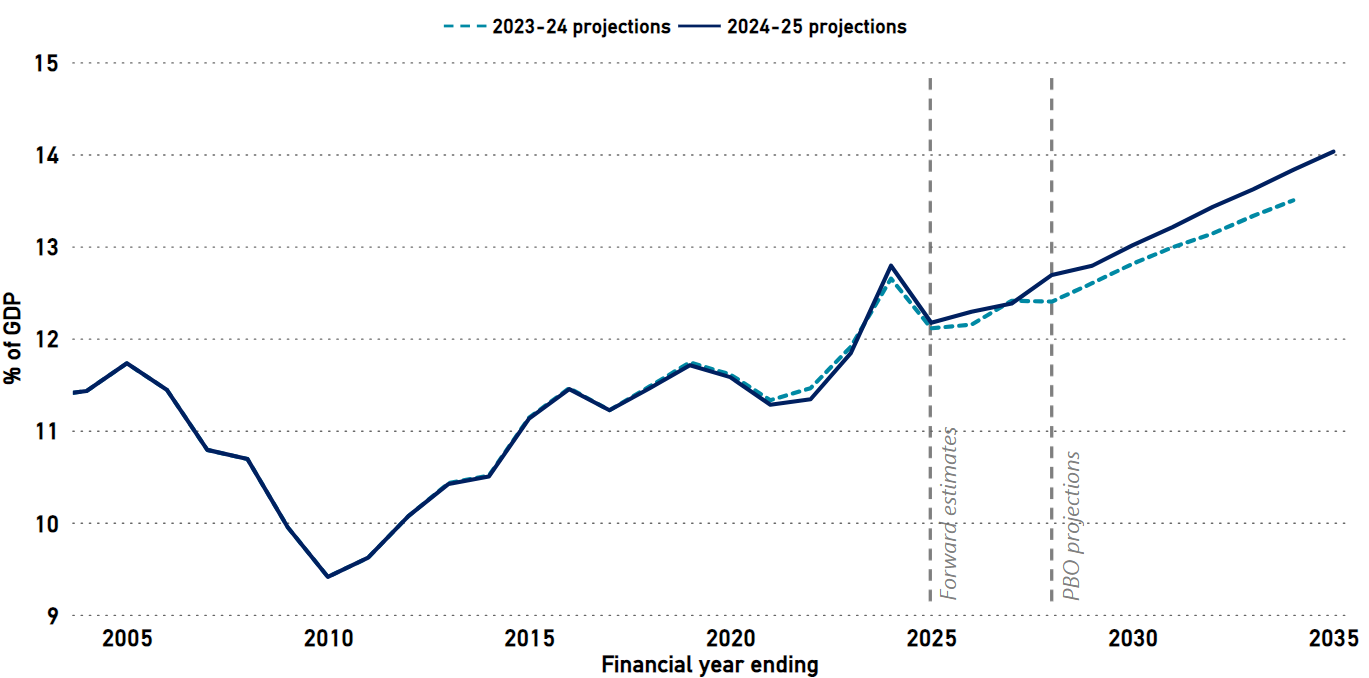
Total revenue (Figure 4-1) is projected to be slightly larger as a share of GDP across the medium term compared to our 2023-24 projections, despite downward revisions to superannuation tax receipts and excise revenue. This improvement is largely attributed to projected increases in personal income tax receipts.
Figure 4-1: Total revenue, 2003-04 to 2034-35

Source: 2023-24 Budget, 2024-25 Budget, and PBO analysis.
Revenue policy decisions in the 2024-25 Budget were also estimated to improve the budget position by $8.1 billion over the forward estimates, primarily associated with increased tax compliance.10
Personal income tax accounts for most of the increase in total revenue as a share of GDP across the medium term (Figure 4-2). This reflects nominal income growth and associated bracket creep, despite the introduction of the Cost of living tax cuts measure which replaced the previous Stage 3 personal income tax cuts.
Further increases to the Superannuation Guarantee (SG) rate will generate slightly increasing revenue from superannuation fund taxes. As at 1 July 2024, the SG rate will be 11.5% for 2024-25 and is legislated to increase by 0.5 percentage points each year until it reaches 12% in 2025-26.
While the increase in SG rate leads to an increase in revenue from superannuation taxes, it is expected to have an overall net negative impact on total tax revenue. This is because higher employer superannuation contributions are typically borne by the employee through slower growth in salary and wages.11
Superannuation contributions are taxed at a concessional rate (generally 15%), while salaries and wages are taxed at higher rates, on average, through the personal income tax system. For comparison the average marginal tax rate on personal income tax is estimated to be 26.1% in 2023-24.12
Figure 4-2 shows the largest movements in revenue as a share of GDP over the next 10 years, split between changes over 2024-25 to 2027-28 and the medium term (2027-28 to 2034-35) periods.
Figure 4-2: Changes in tax revenue, 2024-25 to 2034-35

Source: 2024-25 Budget and PBO analysis.
As a share of GDP, the contribution to receipts from company tax collections is forecast to decline from current elevated levels, as commodity prices return to the long run level assumed in the 2024-25 Budget. For more information, please refer to section 4.4 – Company tax and commodity prices.
GST is projected to remain largely stable as a share of GDP across the medium term, as are most other revenue categories with the exception of fuel and tobacco excise, which are expected to decline over the forward estimates and medium term.
Projected revenue from tobacco excise has been heavily revised down since a year ago. The 2024-25 Budget revised forecast revenue for 2026-27 from $14.7 billion to $11.1 billion, a 24% downgrade. In the 2023-24 Budget, tobacco excise was forecast to increase by 15% between 2022-23 and 2026-27. It is now expected to fall by 12% across the same period. Our projections continue that trend through the medium term.
Fuel excise revenue will depend on the rate of take-up of electric and low-emission vehicles, which is currently highly uncertain. Box 4 explores the impact of different scenarios for excise.
Table 4-1 shows the revenue sources with the largest movements between 2024-25 and 2034-35 as well as the change as a share of GDP. As a contributor to total revenue growth, personal income tax receipts overshadows all other revenue sources.
Table 4-1: Comparison of revenue estimates (top 6)

Note: ‘Change’ refers to the total change between 2024-25 and 2034-35. Numbers may not sum due to rounding.
Source: 2024-25 Budget and PBO analysis.
For a full comparison of revenue estimates, refer to Table B-1 in Appendix B.
Box 4: Downside excise risks
Excise revenue is projected to decrease from 1.6% of GDP in 2023-24 to 1.4% of GDP in 2034 35, largely due to declining consumption of fuel and tobacco products. Over the past 40 years, excise and customs duty has decreased from around a quarter of total tax to around 7%, and is projected to fall to only 5% of tax over the next decade. This long-run decline is a key driver of an increased reliance on income tax, particularly personal income tax.
For tobacco excise the downward trend is partly due to increasing rates of excise discouraging smoking. For fuel excise, declining consumption of fuel products due to changing consumer demands, such as the increased uptake of electric vehicles, leads to a corresponding decrease in excise revenue.
The future paths for excise tax bases are uncertain. The following scenarios explore the impact of different assumptions where consumption is even weaker than currently assumed (Figure 4-3) and the associated impact on future excise revenue (Figure 4-4).
• Our fuel scenarios have volumes falling by 1.8% and 3.6% relative to our baseline projections, multiplying year-on-year to volumes 20% and 40% cumulatively lower. These scenarios might relate to a faster take-up of electric vehicles. As a result, fuel excise would be around $2.4 billion or $4.8 billion lower, respectively, by the end of the medium term.
• Our alcohol scenarios are less extreme, as this excise base has not exhibited clear trends over time. We show lower growth scenarios, 0.7% and 0.85% less than the baseline, resulting in alcohol excise being around $0.6 billion or $1.3 billion lower, respectively, by the end of the medium term.
• Our tobacco scenarios specify volumes falling by 8% and 12% relative to the baseline assumption, resulting in tobacco excise being around $2.7 billion or $5.6 billion lower respectively by the end of the medium term.
Together, the most extreme downside scenarios would result in excise being lower by $12 billion by the end of the decade.
Figure 4-3: Excise scenarios (volume per capita, 2000-01=100)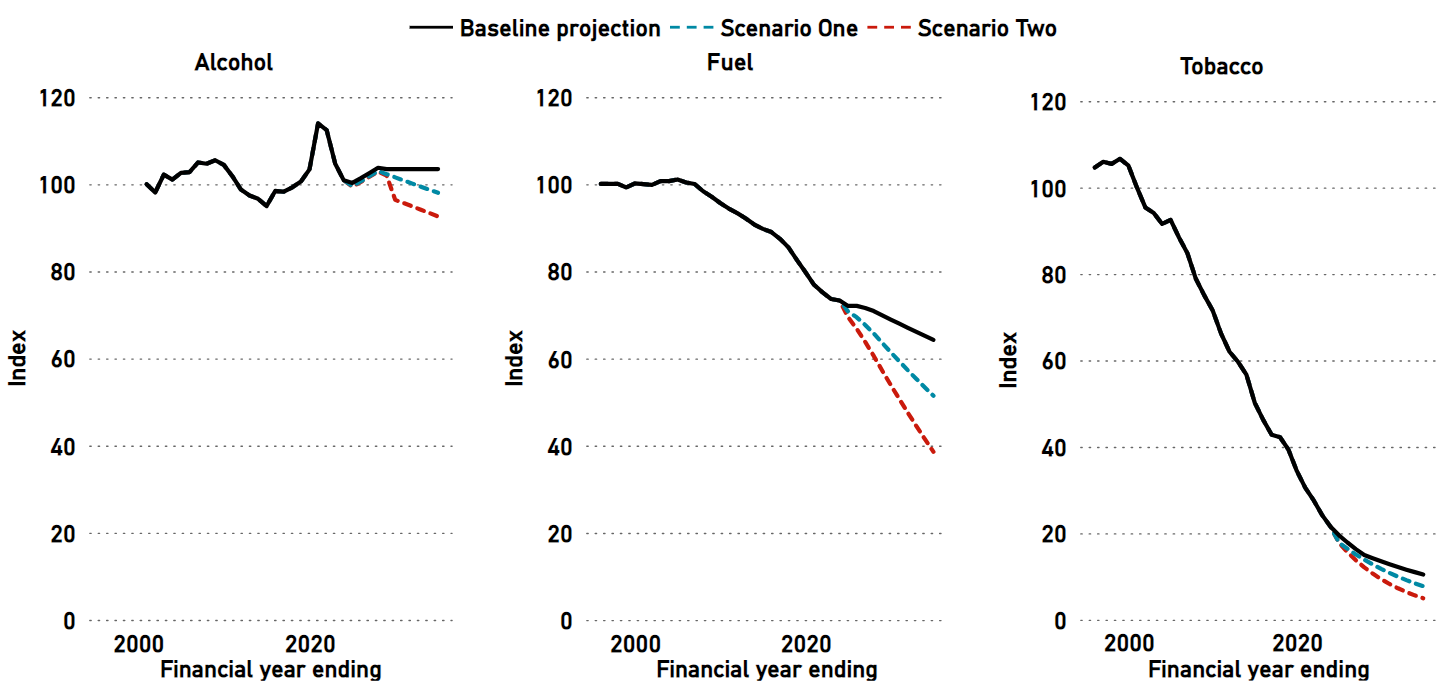
Source: Survey of Motor Vehicle Use (Australian Bureau of Statistics, various editions 1991 to 2020);
Australian Infrastructure and Transport Statistics: Yearbook (BITRE, 2023);
Taxation Statistics (Australian Taxation Office, 2020-21 edition);
Australian System of National Accounts (Australian Bureau of Statistics, 2022-23 edition)
PBO analysis.
Figure 4-4: Impact of changes to excise collection on the UCB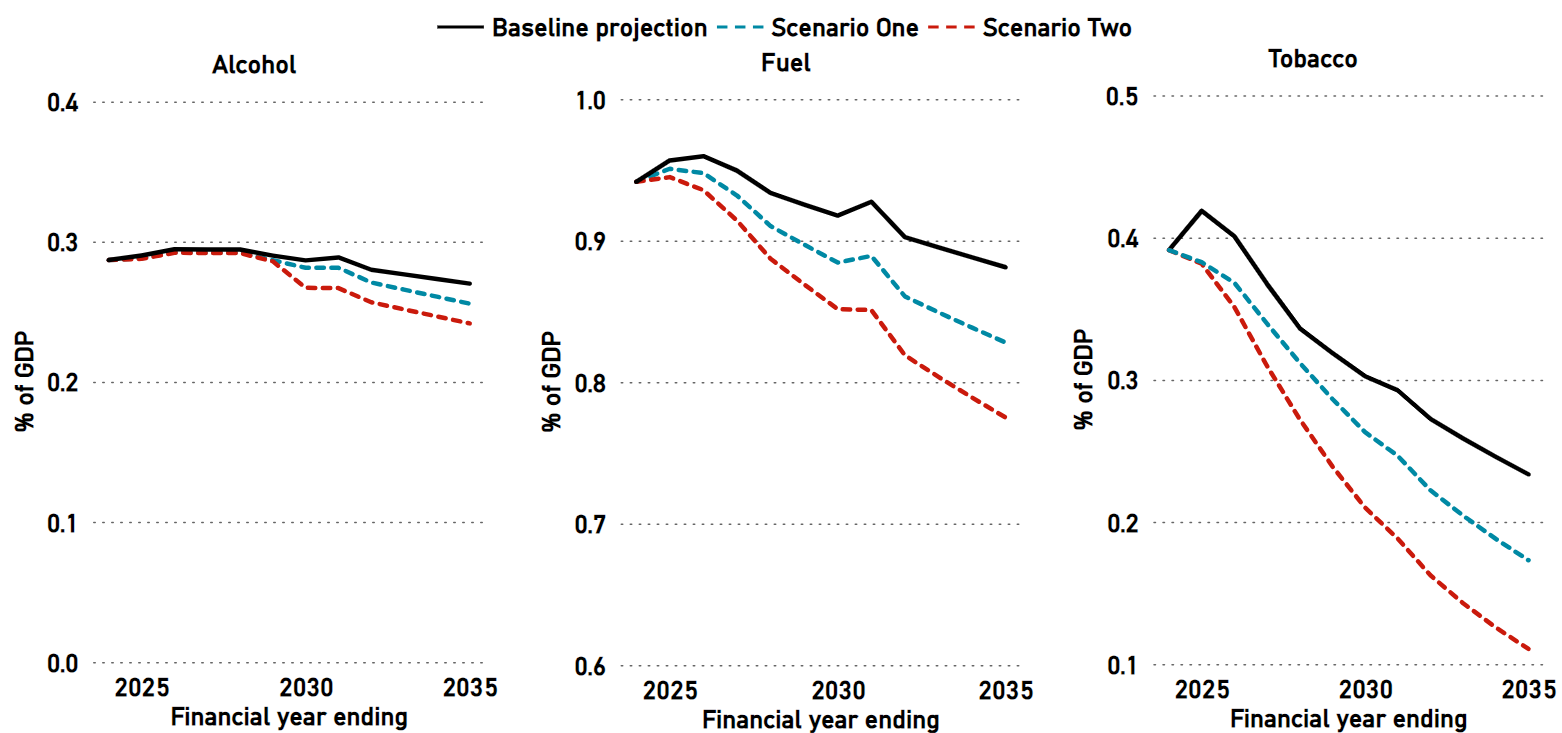
Source: PBO analysis using the PBO’s Build your own budget tool.
Personal income tax revenue (Figure 4-5) is projected to increase from 12.2% of GDP in 2023-24 to 14.0% of GDP in 2034-35, largely due to the continued impact of bracket creep – with higher projections in each year across the medium term compared to our 2023-24 projections.
Figure 4-5: Personal income tax revenue, 2003-04 to 2034-35
Source: 2023-24 Budget, 2024-25 Budget, and PBO analysis.
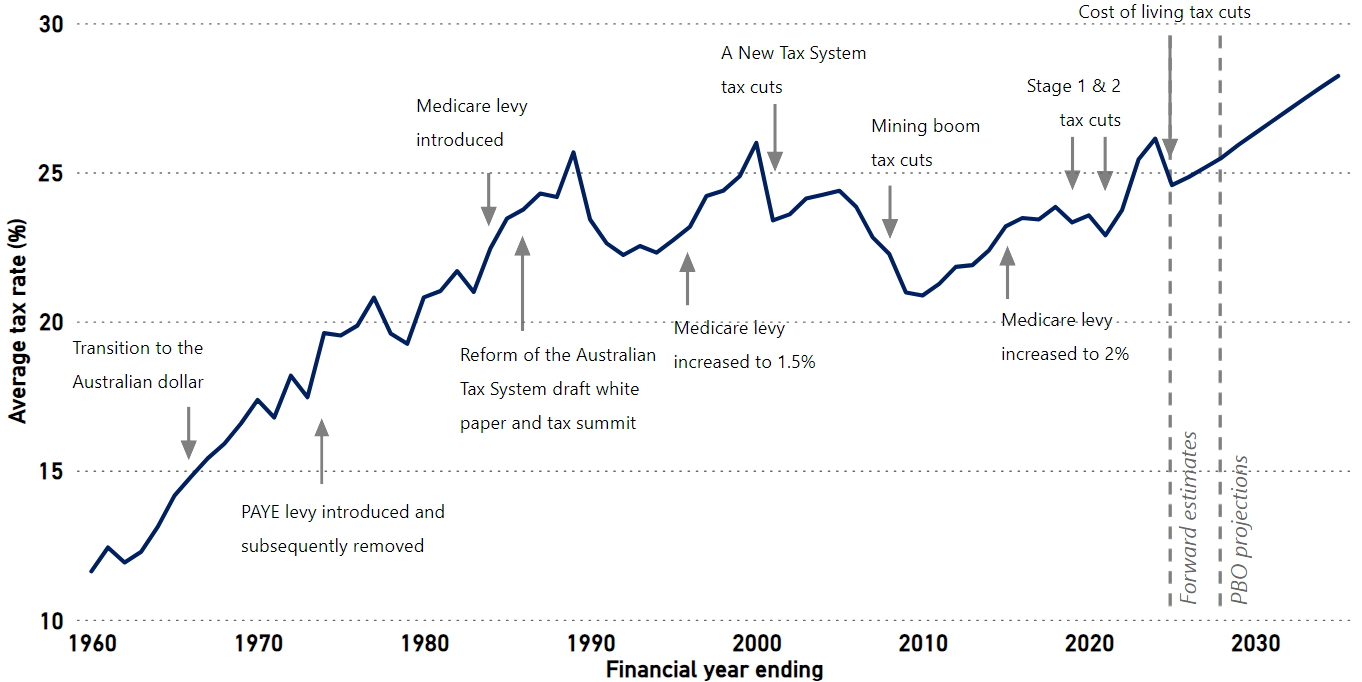
The Cost of living tax cuts, which come into effect from 1 July 2024, cuts will counter some of the impact of bracket creep, reducing the average income tax rate from 26.1% in 2023-24 to 24.6% in 2024-25. However, one-off tax cuts have only a temporary effect in reducing the enduring impact of bracket creep in a tax system with fixed income thresholds.
Without further income tax changes, bracket creep is projected to increase the average tax rate for individuals to 28.2% by the end of the medium term in 2034-35, well above historic highs (Figure 4–6). The sensitivity of the budget to changes in personal income tax rates is investigated further in Box 5 below.
Figure 4-6: Aggregate average personal income tax rate, 1960-61 to 2034-35
Note: For consistency across time, net tax before 2000-01 is calculated before allowance for franking credits. Data for non-taxable individuals is unavailable prior to 1978-79. The net tax rate prior to 1978-79 assumes that taxable income for non-taxable individuals has the impact of reducing the average tax rate by around 0.7 percentage points, the median amount from 1978-79 to 1987-88.
Source: ATO Taxation Statistics, 2024-25 Budget, and PBO analysis.
Bracket creep has played an important role in fiscal consolidation after major downturns in the past, including after the 1990s recession and the Global Financial Crisis. The impact of bracket creep on the budget balance is explored further in Box 5 below.
However, as the tax base narrows our reliance on personal income tax increases. Government revenues become more sensitive to both changes in the composition of the economy and future policies to compensate taxpayers for the impact of bracket creep.
Accordingly, governments need to balance the budget benefit of faster fiscal consolidation aided by bracket creep with the increased risks associated with a high reliance on a single source of revenue.
More information on how personal income tax projections compare to history can be found in our Budget Bite, Trends in personal income tax.
Box 5: The impact of bracket creep
Bracket creep occurs when average tax rates rise due to nominal income growth in a tax system with fixed thresholds. Due to the size of the income tax base, any change to personal income will have an enormous impact on the projected fiscal position of the budget.
Figure 4-7 below presents the current baseline scenario for the budget returning to surplus by the end of the medium term (i.e. without returning bracket creep) with an alternative scenario where bracket creep is returned.
• Our baseline projection (incorporating the Cost of living tax cuts) estimates an average tax rate for individuals of 28.2% by the end of the medium term, projecting income tax revenue as a share of GDP to increase from 12.2% in 2024-25 to 14.0% by 2034 35.
• The first scenario increases income tax thresholds in line with forecast and projected CPI. Under this scenario, income tax revenue as a share of GDP is estimated to increase from 12.2% in 2024-25 to 12.7% by 2034-35. Note that indexing thresholds to CPI does not fully compensate for bracket creep, because wages and other incomes tend to grow faster than CPI.
• The second scenario holds the average income tax rate stable at the 2024-25 level of 23.2%, providing ongoing full compensation for bracket creep.
In our baseline projections, the UCB improves over time, returning to surplus by 2034-35. In both scenarios, the budget would never return to surplus, meaning that future governments cannot afford to fully compensate taxpayers for bracket creep without increasing other taxes or substantially cutting spending.
Figure 4-7: Projected underlying cash balance, with and without returning bracket creep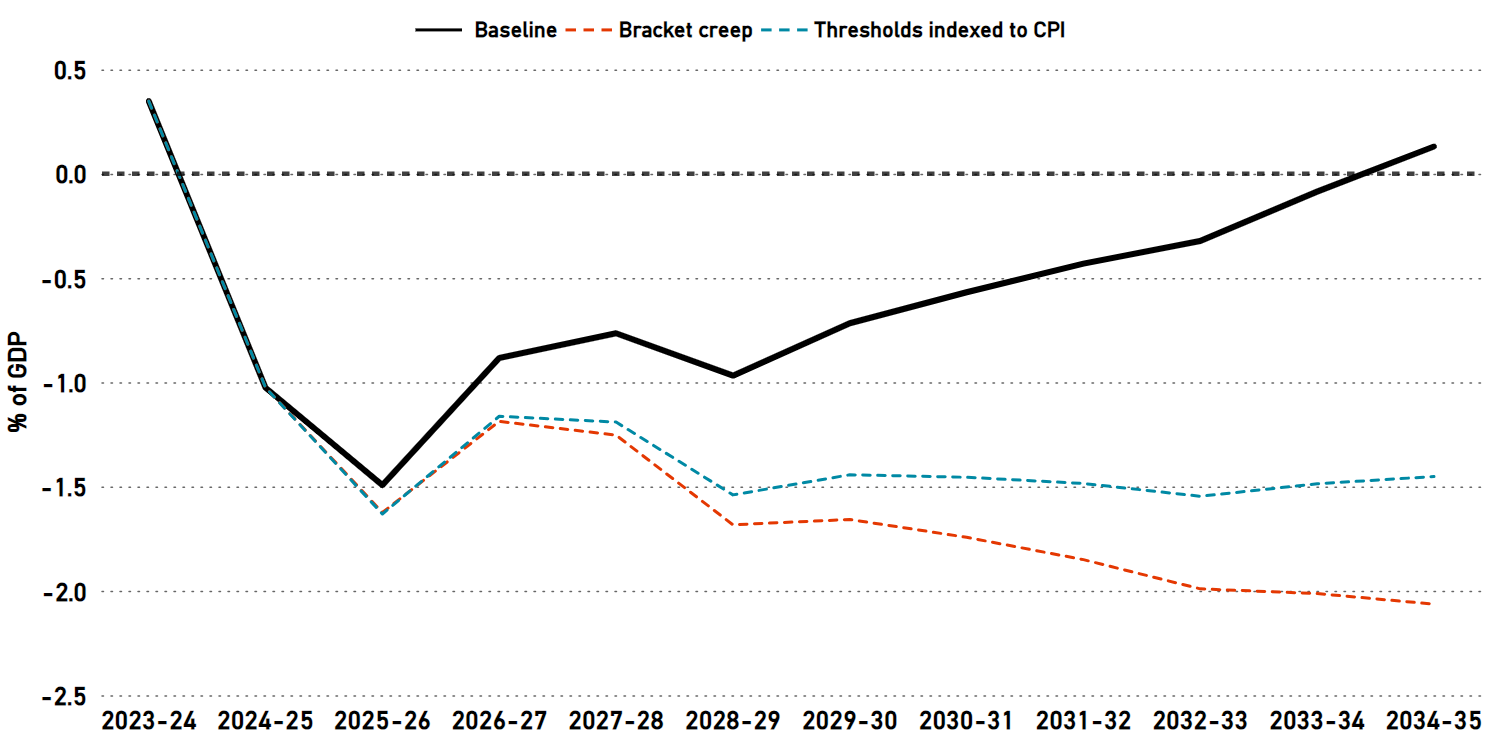
Source: PBO analysis using the PBO’s Build your own budget tool.
Over the past 20 years, fiscal volatility has often been linked to commodity prices, which can benefit or damage the budget via company tax receipts. Due to their unpredictability in the short term, the budget has adopted a technical assumption that commodity prices will fall back towards a long-run level, although the precise path has varied over the years.
In recent years, commodity prices have stayed higher for longer than anticipated in the budget. Surpluses in the past 2 years have been mainly attributed to commodity prices. The 2024-25 Budget again assumes that commodity prices will return to long-term trends, reducing company tax.
The PBO’s latest Build your own budget analysis tool includes a new feature, allowing users to explore the impact on the budget of different commodity price assumptions. As a rule-of-thumb, if key long-run commodity prices are 10% higher or lower than assumed in the budget, the budget balance would increase or decrease by around $5 billion per annum, respectively, by 2027-28. This would increase to around $8 billion per year in a decade.
5 Expenses
- This chapter presents our projections for the main expense categories that determine the budget aggregates.
- Similar to the PBO’s 2023-24 projections, and despite emerging uncertainties, total expenses are projected to remain relatively stable across the medium term, decreasing from 26.6% of GDP in 2024-25 to 26.1% of GDP in 2034-35, in part due to a projected falls in grants funding for states and territories.
- Expenditure on the NDIS is projected to increase from 1.7% of GDP in 2024-25 to 2.2% of GDP in 2034-35, with more participants projected to enter the scheme and average per participant costs expected to rise.
- Interest expenses are projected to increase from 1.2% of GDP in 2024-25 to 1.5% of GDP in 2034-35, as a result of rising interest rates and as the low-interest rate bonds issued during 2020 and 2021 begin to mature.
Total expenses (Figure 5-1) are projected to be relatively stable as a share of GDP across the medium term. Despite increased expenditure on interest and defence, this is broadly similar to our previous projections, following historical upward revisions to GDP.
Figure 5-1: Total expenses, 2003-04 to 2034-35

Source: 2023-24 Budget, 2024-25 Budget, and PBO analysis.
While total expenditure as a share of GDP has remained relatively consistent with our previous projections, measures in the 2024-25 Budget were estimated to worsen the budget position by $24.8 billion across the forward estimates.13
Expenses are projected to remain relatively stable as a share of GDP over the medium term, owing to 3 large programs growing much faster than GDP, offset by several programs projected to decline. While interest payments on Australian Government Securities are now the fastest growing major payment over 10 years, the NDIS remains the most significant driver of growth in expenses as a share of GDP due to its relative size. Through the 2024 National Defence Strategy, the Government has committed to an additional $50.3 billion in defence spending over the medium term, making defence spending the third largest contributor.
Compared to our 2023-24 projections, NDIS growth has moderated slightly, while expenses for interest and defence have increased. Expenditure on defence is projected to increase by almost 89% between 2024-25 and 2034-35.
Figure 5-2 presents the programs with the largest expected movements in expenses as a share of GDP across the forward estimates and the medium term.
Figure 5-2: Changes in expenses, 2024-25 to 2034-35

Source: 2024-25 Budget and PBO analysis.
Table 5-1: Comparison of the largest expense programs in the 2024-25 Budget (top 10)
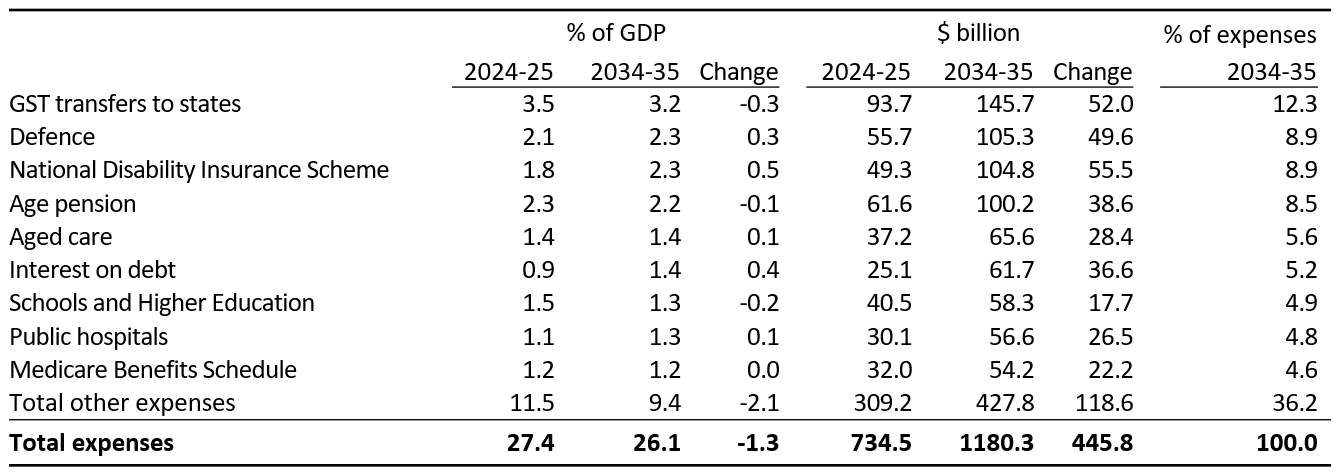
Note: NDIS includes additional administration expenses and will be slightly higher than figures in the Interactive analysis – net operating balance, revenue and expenses chart and the PBO’s Build your own budget tool.
Source: 2024-25 Budget, and PBO analysis.
The programs presented here are a combination of forward estimates in the 2024-25 Budget and PBO projections across the medium term. For a full comparison of the largest expense programs, refer to Table B-2 in Appendix B.
Similar to recent editions of Beyond the budget, the NDIS, interest payments and defence categories have the greatest increase as a percentage of GDP while the ‘total other expenses’ category is the main contributor to expenditure restraint. This category includes discretionary government grants, but does not include any provision for future grants. Grant funding and other general government operating costs (‘departmental expenses’) are discussed further in section 5.4.
NDIS expenditure remains one of the fastest growing major payment items in the 2024-25 Budget, despite the agreement of the National Cabinet to a NDIS Financial Sustainability Framework to moderate growth in the NDIS total scheme expenditure to no more than 8% per year by 1 July 2026.
In December 2023 the Scheme actuary released the NDIS Annual Financial Sustainability Report 2022-23. The report projected that NDIS total participant costs would grow from $55.2 billion in 2026-27 to $92.3 billion in 2032-33. This is an average annual growth rate of 9% per year, above the 8% target.
In order to meet the target 8% growth rate in NDIS expenditure, the 2024-25 Budget included a set of ‘getting the NDIS back on track’ measures, which, in addition to providing greater funding to the NDIS Quality and Safeguards, aim to rein in NDIS expenses through greater program compliance. As a result of these measures, the 2024-25 Budget projected NDIS savings similar in magnitude to the upward revision of NDIS expenses due to the actuary’s projections.
The 2024-25 Budget notes the annual growth target for scheme costs of no more than 8% after 2026 is dependent on the successful implementation of the Financial Sustainability Framework. However, this is reliant on the forecast compliance and other savings being realised as well as projected participant growth rates, which in a demand-driven program are highly sensitive to external factors, not exceeding their current trajectories.
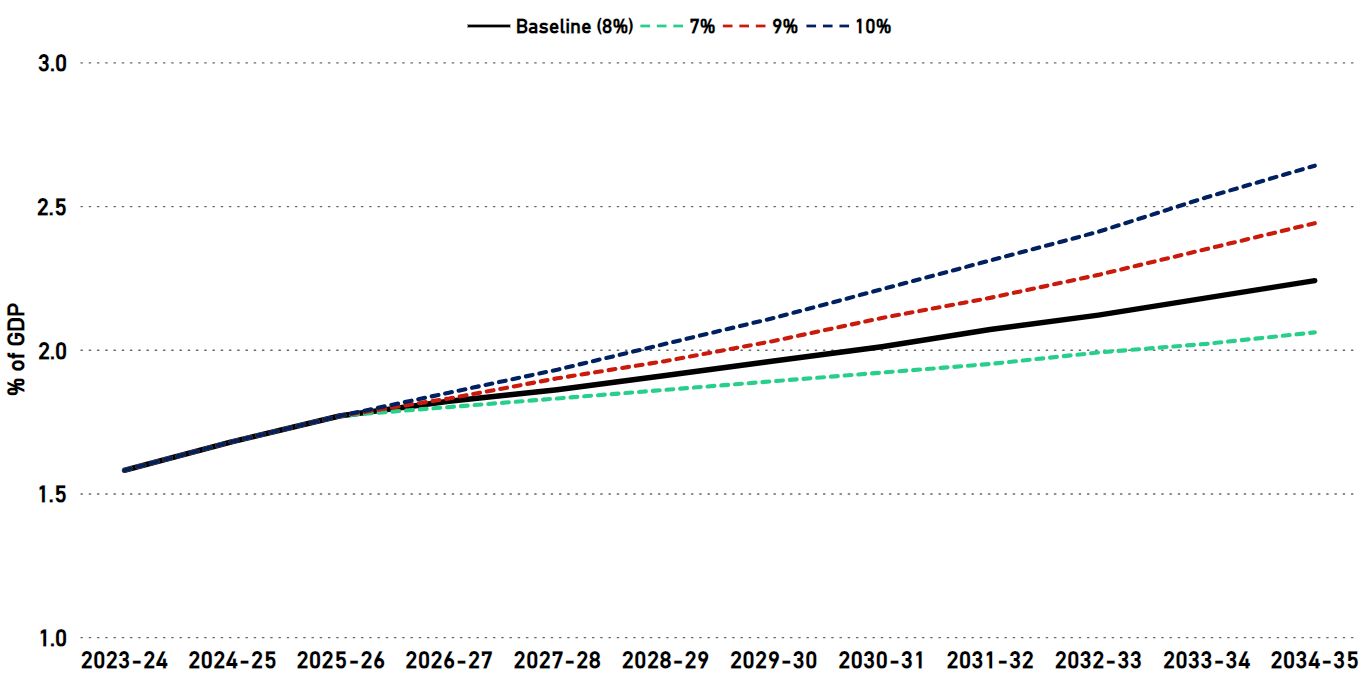
To illustrate the potential impact of this risk, Figure 5-3 below provides a comparison of the fiscal balance under different NDIS expenditure growth scenarios:
- Higher growth: growth in NDIS total scheme expenditure from 2026-27 onwards is 10% per annum, 1 percentage point higher than the Scheme actuaries.
- Actuaries’ prediction (without the new measures): growth in NDIS total scheme expenditure from 2026-27 onwards is 9%, consistent with the NDIS Annual Financial Sustainability Report 2022-23.
- PBO baseline projection: growth in NDIS total scheme expenditure moderates to 8%, consistent with the assumptions in the 2024-25 Budget by 1 July 2026 and remains at this level across the medium term.
- Lower growth: growth in NDIS total scheme expenditure moderates further to 7% by 1 July 2026 and remains at this level across the medium term, 1 percentage point lower than the baseline.
If the growth rate of the NDIS were 1 percentage point lower than the baseline projection this would result in around $8 billion less NDIS expenditure by 2034-35. However, if the growth rates were 1 percentage point higher than current actuarial projections this would increase NDIS expenditure by around $19 billion by 2034-35.
Figure 5-3: NDIS expenditure growth scenarios, 2024-25 to 2034-35
Source: 2024-25 Budget and PBO analysis.
Similar to previous editions of Beyond the budget, the main factor constraining projected growth in expenses is the category ‘all other expenses’. This is a grouping of items which are largely driven by government policy rather than external economic factors. One reason why this group of expenses grows relatively slowly is that the policies expire over time.
Ongoing programs, such as the Age Pension will continue as specified indefinitely unless explicitly altered or terminated. Forecast accuracy for these programs largely depends on the accuracy of the economic forecasts underpinning the budget.
In contrast, some programs are not funded beyond a specific date or amount and will naturally expire. The budget includes allowances only for announced policy. Subsequent measures with additional funding are almost always introduced in these areas, so the budget forecasts will usually understate the future outcomes.
A key example of this is road and rail infrastructure grants to State and Territory governments, for which the budget includes an allowance only for announced projects. The forecasts and projections rapidly fall away over the next decade as the projects are assumed to be completed. There is no allowance in the budget for grants for future projects that are yet to be determined or announced.
Another major category of ‘all other expenses’ is departmental costs, which include the wages and other labour costs for public servants, contracted labour costs, and general running costs such as utilities, travel and requisites. Budget estimates for departmental costs tend to grow slowly due to successive governments’ policy of applying an ‘efficiency dividend’ to public service output, and the budget assumption for wage costs also tends to grow slowly.14 Historically, these costs are almost always under-forecast, with outcomes higher than the earlier estimates. For example, the 2022-23 outcome for these costs was 23% higher than first estimated at the 2019-20 Budget. Departmental costs may be revised upwards for many reasons, such as new or expanded government programs, responding to unforeseen events and unanticipated increases in prices.
Figure 5-4 shows the evolution of budget forecasts for grant expenses (excluding current grants to other governments) and departmental costs, illustrating the tendency for these forecasts to be revised upwards over time. The charts demonstrates that future expenditure is often under-estimated, largely because governments often introduce new funding for administering programs. The medium-term projections use the final year of the forward estimates as a base from which to grow, so these projections will be under-estimated to the same degree.
Figure 5-4 Grant expenses and departmental expenses15
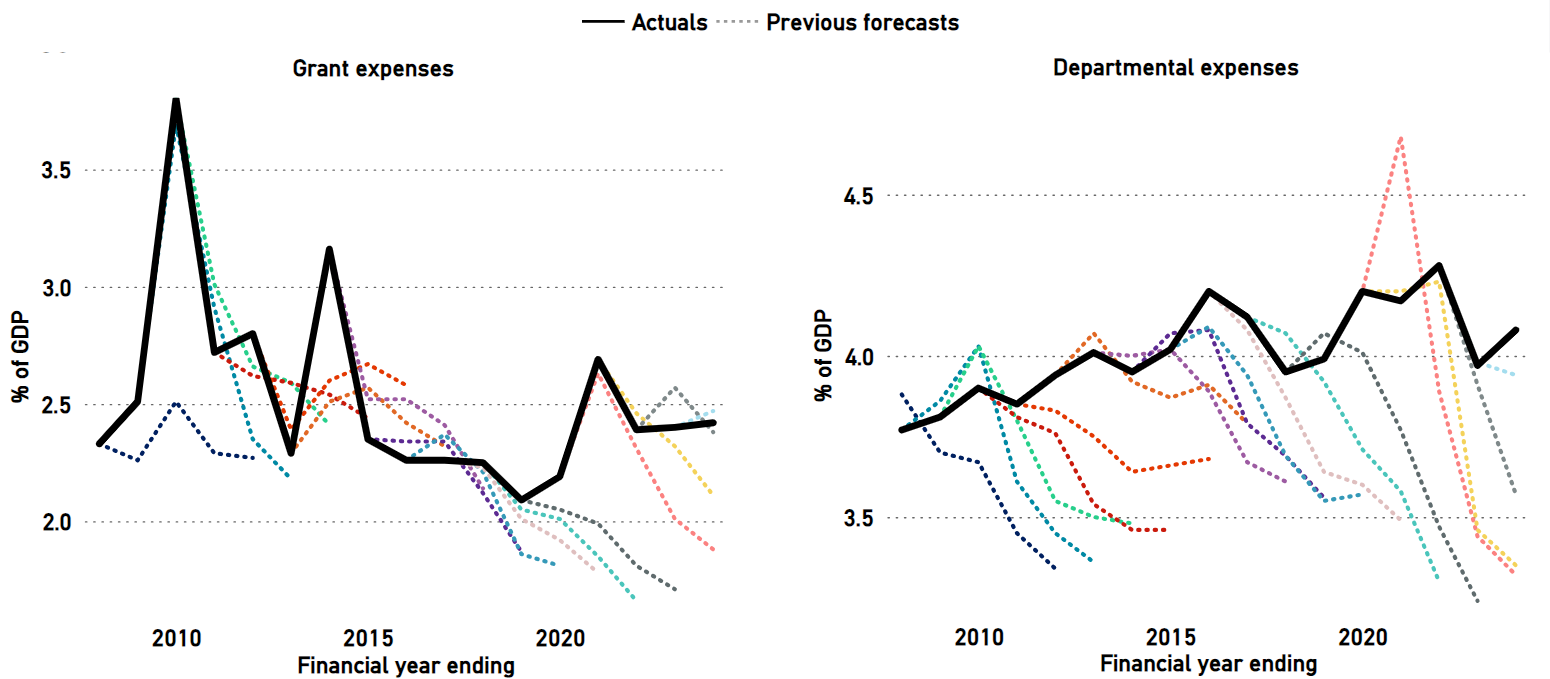
Note: Current grants to state and territory governments have been omitted as these are largely revenue from the GST, which is directly passed on from the Commonwealth government and is thus determined by economic activity rather than policy, and agreements for hospitals and schools, which are assumed to be ongoing.
Source: Budget papers from 2007-08 to 2024-25 and PBO analysis.
Grant expenses have tended to be revised upwards over the past 8 years, but the earlier periods were more mixed. Departmental expenses almost always end up higher than forecast.
The recent average difference between the original forecast and the outcome for these grants is around 0.5% of GDP, and also around 0.5% of GDP for the departmental expenses.
If an allowance were made for these average differences, the UCB would be around $50 billion worse by 2034-35, with a cumulative impact on debt of around $300 billion higher than our baseline projections.
Over a longer period of history, the average difference is smaller for grants but around the same for departmental expenses. The analysis presented earlier in Box 3 explores scenarios where these grants are 0.25% of GDP higher (reflecting the more varied history) and departmental expenses are 0.5% of GDP higher.
Appendices
This appendix outlines the economic context for our Beyond the budget 2024-25 and the underlying methodology.
The PBO’s projections in this report are based on the policy settings, economic parameters, and budget outcomes of the most recent Australian Government budget. References throughout this report for the period to 2027-28 (the ‘forward estimates’), are based on the 2024 25 Budget, while references to the fiscal projections in the period beyond 2027-28, or the medium term, represent the PBO’s projections. The PBO’s medium term projections are developed independently but are broadly consistent with the medium-term budget position presented in the 2024-25 Budget. The PBO’s projection for the UCB in 2034-35 is not significantly different to that presented in the budget.
Projections for revenue are generally prepared using a ‘base-plus-growth’ methodology. Economic parameters are used to estimate growth rates, which are then applied to the relevant base. Projections for expenses are prepared by multiplying the number of expected recipients by the average expense and consider a range of factors. These include population growth, the age structure of the population, estimates of trends in the demand for government services, and program indexation arrangements.
Major fiscal aggregates are presented on both an accrual and cash basis and prepared through a balance sheet framework that uses accounting identities, consistent with our previous reports. Detailed revenue and expense projections are on an accrual basis.
For further information on our balance sheet framework, see the technical appendix to our Beyond the budget 2021-22 report.
Forecasts and projections of economic parameters underpin our analysis. The key economic parameter forecasts are summarised in Budget Paper No. 1 of the 2024-25 Budget (Table 1.1).
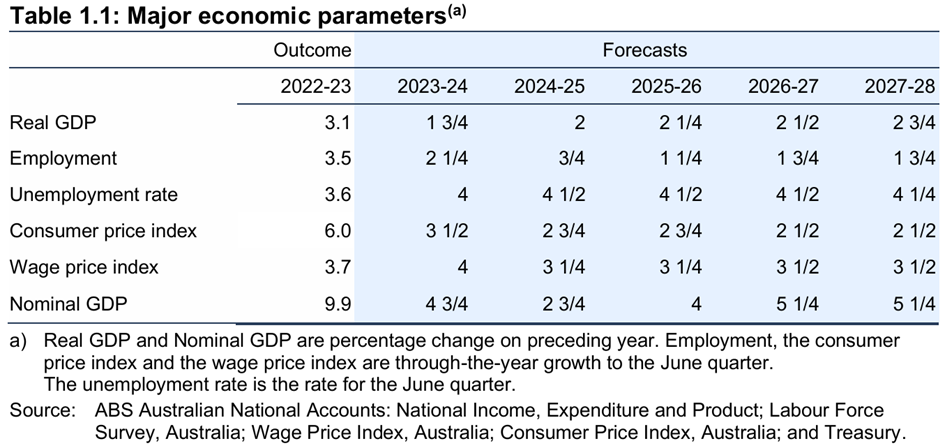
Source: As presented in Budget Paper No.1, 2024-25 Budget, page 6. While the budget does not include a comparison of these economic parameters with those from the previous fiscal update, our 2024-25 Budget Snapshot, released on budget night, presents the changes.
The key changes in the economic outlook presented in the 2024-25 Budget compared to the 2023-24 Budget (the starting point for our Beyond the budget 2024-25 report) are:
- Economic growth (nominal GDP) is forecast to be slightly higher in 2024-25 but then lower in 2025-26 (shown in Figure A-1 below).
- Employment growth is forecast to be lower from 2024-25 to 2025-26, but then broadly consistent in 2026-27.
- Inflation, measured by the Consumer Price Index (CPI), is forecast to be the same in 2024-25, but higher in 2025-26 before becoming broadly consistent from 2026-27.
Figure A-1: Nominal GDP growth, 1997-98 to 2027-28

Note: All values prior to and including 2021-22 are outcomes.
Source: 2024-25 Budget, previous budgets, and PBO analysis.
Estimates of fiscal aggregates in the forward estimates period provide the starting point for our fiscal projections across the medium- and long-term periods. Estimates of key fiscal aggregates across the forward estimates are also summarised in Budget Paper No. 1 of the 2024-25 Budget (Table 1.2).
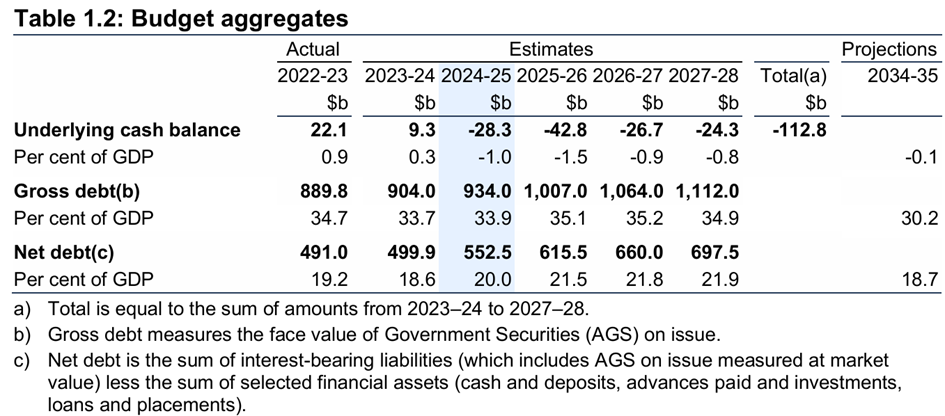
Source: As presented in Budget Paper No.1, 2024-25 Budget, page 7.
Changes in the budget aggregates between budgets reflect the impact of the prior year actuals as a starting point, parameter variations and policy decisions.
Based on the estimates in the 2024-25 Budget, 2023-24 is expected to be significantly better than was forecast in the 2023-24 Budget. This has improved the starting point for the budget aggregate estimates, especially the debt path.
Economic parameter variations contributed the most to the change between budgets, compared to new policy decisions (see Figure A-2).
Figure A-2: Change in underlying cash balance since the 2023-24 Budget

Source: 2024-25 Budget, and PBO analysis.
The key risks to the economic outlook, as articulated in the 2024-25 Budget, are on the downside, with uncertainty around global economic conditions flowing through to Australia. Key risks relate to the impacts of geopolitical instability, as well as higher than anticipated inflation and interest rates. More detail on the economic outlook and the risks are in Budget Statement 2: Economic Outlook.
Medium-term fiscal strategy
The government’s fiscal strategy, as outlined in the budget, has a direct effect on our medium-term projections and fiscal sustainability analysis.
The 2024-25 Budget fiscal strategy was unchanged from the 2023-24 Budget, to ‘improve the budget position in a measured way, consistent with the overarching goal of reducing gross debt as share of the economy over time’, underpinned by ‘allowing tax receipts and income support to respond in line with changes in the economy and directing the majority of improvements in tax receipts to budget repair’ and ‘Limiting growth in spending until gross debt as a share of GDP is on a downwards trajectory, while growth prospects are sound and unemployment is low.’16
Bridging the balances
The net operating balance, fiscal balance, headline cash balance, and primary cash balance are common aggregates used in conjunction with the underlying cash balance to examine the budget position.
- The net operating balance (NOB) is equal to the government’s revenue minus its expenses, excluding expenses related to revaluations (such as the write-down of assets). The NOB is an accrual measure, recognising income when it is earned and expenses when they are incurred, even though the associated cash transactions may occur in different financial years.
- The fiscal balance (FB) is also an accrual measure and builds on the NOB. It is equal to the NOB less the government’s investments in non-financial assets (such as military equipment) at the time they are acquired or sold. The FB performs a similar function to the underlying cash balance, but on an accrual basis.
- The underlying cash balance (UCB) is the difference between the government’s receipts and its payments. The UCB is a cash measure, which means it records income when it is received and payments when they are made, even though those amounts might have been earned or incurred in a different financial year. Generally, when the government or the media say that the budget is in a deficit or a surplus, they are referring to the UCB.
- The headline cash balance (HCB) is similar to the UCB, but it also accounts for the government’s investment in financial assets for policy purposes (such as student loans and equity injections). Policies affecting the headline cash balance can have an impact on debt even if they do not affect the underlying cash balance.
- The primary cash balance (PCB) adjusts the UCB to exclude net interest payments. As governments have little control over interest payments in the short term (interest payments are largely determined by the size of previous budget deficits), it can be useful to view this as a budget balance that is largely within the government’s control.
For further information, see our Online budget glossary.
For further information, see our Online budget glossary.
Table B-1: Comparison of revenue programs

Note: 'Change' refers to the total change between 2024-25 and 2034-35. Numbers may not sum due to rounding.
Source: 2024-25 Budget and PBO analysis.
Table B-2: Comparison of expenses programs

Note: ‘Change’ refers to the total change between 2024-25 to 2034-35. Defence expenditure from 2026-27 is based on the growth in long-term funding commitments made in the 2020 Defence Strategic Update. The base is expenditure for Defence in the most recent Portfolio Budget Statements. For 2031-32, 2032-33, and 2033-34, the PBO has assumed growth in defence spending would be maintained at 5.5%, consistent with the 2023 Defence Strategic Review. Numbers may not sum due to rounding.
Source: 2024-25 Budget and PBO analysis.
For more explanation of these and other terms, see the PBO’s Online budget glossary.
Accrual accounting
Accrual accounting records income when it is earned, and records costs when they are incurred, regardless of when the related cash is received or paid. Under accrual accounting, government income is called ‘revenue’ and costs are generally called ‘expenses’. As an example, under accrual accounting, goods and services tax revenue is recorded in the financial year that the goods and services are purchased, even though the government may not receive the related tax amounts until the following financial year.
Cash accounting
Cash accounting records income when cash is received, and records costs when cash is paid out, regardless of when those amounts are earned or incurred. For example, under cash accounting, goods and services tax receipts are recorded in the financial year they are received, even though those tax amounts may relate to goods and services purchased in the previous financial year. Under cash accounting, government income is called ‘receipts’ and costs are called ‘payments’.
Expenses
Expenses in the budget context refers to the cost of providing government services, excluding costs related to revaluations such as the write down of assets. Examples include spending on programs such as the Age Pension or Medicare, funding provided to the states and territories for public hospitals, or the wages paid to Australian Government employees.
Fiscal balance
The fiscal balance is an accrual accounting measure of the budget balance equal to the government's revenue (for example from taxes) minus its expenses (from providing services such as Medicare and income support such as the Age Pension), adjusted for government capital investments such as military equipment (known as 'net capital investment in non-financial assets') when they are acquired or sold.
Fiscal sustainability
The government’s ability to maintain its long-term fiscal policy arrangements indefinitely, without the need for major remedial policy action. A fiscally sustainable position is one which can be maintained while pursuing similar borrowing and repayment approaches over the long term, such that taxation and spending can be expected to operate within reasonable and expected bounds.
Gross debt
In the budget papers, gross debt is the sum of interest-bearing liabilities, consisting of Australian Government Securities on issue, based on their value when the securities were issued (their 'face value'). Gross debt does not include any of the government’s financial assets that partly offset that debt, or any smaller debts that are not Australian Government Securities.
Headline cash balance
The headline cash balance (HCB) is a cash measure of the budget balance equal to the government's receipts (for example from tax collections) minus payments for operations and investment activities (including certain investments in financial assets). If receipts are lower than payments, the headline cash balance is in deficit, meaning the government does not have sufficient cash to cover its activities and must borrow from financial markets.
Net debt
Net debt is the sum of selected financial liabilities (deposits held, advances received, government securities, loans, and other borrowings) less the sum of selected financial assets (cash and deposits, advances paid, and investments, loans, and placements). It is a common measure of the strength of a government’s financial position. In the net debt calculation, Australian Government Securities are valued as the price they are currently trading at (their 'market value') rather than their value when the securities were issued (their 'face value').
Net financial worth
Net financial worth measures the total financial assets (such as cash or shares in a company) held by a person or organisation at a fixed point in time, minus the value of any liabilities, such as outstanding debts. Net financial worth is a broader measure of the government's financial position than net debt, but it is narrower than net worth.
Net worth
Net worth measures the government’s overall wealth, calculated as total assets (both financial and non-financial) less total liabilities. Net worth is the broadest measure of the government’s financial position.
Payments
Payments capture all outgoing cash transactions from the Australian Government to individuals, organisations, or other levels of government. In the budget context, payments are those that affect the underlying cash balance and comprise cash transactions for operating activities and the purchase of non-financial assets. Examples include an Age Pension payment, a Medicare rebate for a doctor's visit, and the wages of a Centrelink employee.
Interest payments
Interest payments are the cash payments on the government’s debt liabilities which are recorded as a cost to government in the budget. Net interest payments are equal to interest payments minus the cash interest receipts earned by the government on investments in interest-bearing financial assets.
Primary cash balance
The primary cash balance adjusts the underlying cash balance to exclude interest payments on debt as well as interest receipts. As governments have little control over interest payments in the short term (interest payments are largely determined by the size of previous budget deficits), it can be useful to view this as a budget balance that is largely within the government’s control.
Receipts
Receipts are the government's income, recorded at the time they are received as reported on a cash accounting basis. In the budget context, receipts are those that affect the underlying cash balance, so exclude the repayment of loans and other cash flows relating to the exchange of financial assets. Most government receipts are tax receipts, such as company tax, personal income tax, and goods and services tax. The government also receives non-tax receipts, such as interest earned on government loans and dividends from government investments.
Revenue
Revenue is government income, recorded at the time it is earned and reported on an accrual accounting basis. Most government income is made up of tax revenue, such as company tax, personal income tax, and goods and services tax. The government also receives non‑tax revenue, such as interest earned on government loans and dividends from government investments.
Underlying cash balance
The underlying cash balance (UCB) is a cash measure of the budget balance equal to the difference between the government's receipts and its payments. It is one of several indicators known as ‘budget aggregates’ that measure the impact of the government's budget on the economy. When the government or the media say the budget is in surplus or deficit, they are generally referring to the underlying cash balance, or sometimes the net operating balance or fiscal balance. More specifically, the underlying cash balance is equal to the government's receipts (for example from tax collections) minus its payments from providing services (such as Medicare) and support (such as the Age Pension). The types of receipts and payments used in the calculation include those from buying and selling non‑financial assets, such as buildings or equipment. The term ‘underlying’ is used because it excludes some cash transactions that are captured in the broader, but less commonly used, headline cash balance. Box 2 and Appendix A discuss the various budget balances in more detail.
- Australian Government (2024) 2024-25 Budget, Budget Paper No. 1, page 90, Australian Government.
- Reserve Bank of Australia (n.d.) Cash Rate Target, RBA website, accessed 10 May 2024. Changes to the cash rate since May 2024 are not factored into the 2024-25 Budget baseline.
- Australian Government (2024) 2024-25 Budget, Budget Paper No. 1, page 247, Australian Government.
- The ‘bumpy’ profile for interest payments reflects the times when the various existing bond lines mature. The 2024-25 edition of Beyond the budget incorporates more sophisticated modelling for debt financing.
- Interest may be considered as a payment related to accumulated past budget balances, meaning that the primary balance may be a more appropriate measure of the government’s current fiscal stance.
- Australian Government (2024) 2024-25 Budget, Budget Paper No. 1, Table 3.4, page 102, Australian Government.
- Our cases assume each of the 3 variables that determine the debt-to-GDP ratio across the long term converge to our assumed values after 2034-35.
- See Table B-2 for more information
- Australian Government (2023) Intergenerational Report 2023, page 146, Australian Government.
- Australian Government (2024) 2024-25 Budget, Budget Paper No. 1, page 172, Australian Government.
- Grattan Institute (2020) No free lunch: higher super means lower wages, page 3, Grattan Institute.
- The average marginal tax rate is calculated as the average tax that would be paid on an additional $1 of income for the entire taxpayer population, weighted by taxable income.
- Australian Government (2024) 2024-25 Budget, Budget Paper No. 1, page 194.
- The economic parameter for forecasting departmental costs is typically one of the ‘wage cost indices’, which generally grow slower than forecasts for either wages or prices (CPI). The PBO’s explainer, Indexation & the budget – an introduction, discusses these parameters and their application.
- 'Departmental expenses’ is here defined as the sum of ‘Total employee and superannuation expenses’ (2024-25 Budget, page 377) and ‘Supply of goods and services’ (the subcomponent, not the total, 2024-25 Budget, page 378). This definition is somewhat different to that presented in Budget Paper 4 ‘Agency Resourcing’ (page 168) but that data goes back only to the 2015-16 Budget and the final outcomes are not published. The trends in revisions to the estimates are broadly the same for each definition over the comparable years.