This Budget Bite presents trends in personal tax in a historical context, building on previously published work on bracket creep 1 , updated to reflect the 2022-23 October Budget. The role of personal tax in the broader tax system and for the Commonwealth budget is considered with reference to 3 key design principles: efficiency, equity, and sustainability2.
Personal tax has been the largest source of Australian Government revenue since 1942-43. As wages grow, bracket creep increases Australia’s reliance on personal tax even further, so governments have periodically introduced tax cuts to adjust this level of reliance. The 3 stages of tax cuts in the Personal Income Tax Plan, first announced in the 2018-19 Budget (with subsequent amendments), is the latest example.
Efficiency: Australia’s reliance on personal income tax is trending towards historically high levels
All forms of taxation impact economic activity, but an efficient tax system is one that minimises these impacts. An over-reliance on any one form of taxation usually means higher rates for that tax, reducing its efficiency. It can also leave government revenues vulnerable to changes in the composition of the economy over time, such as a reduction in the ratio of working age people to the total population associated with demographic change.
Compared to other advanced economies, Australia has a low total tax-to-GDP ratio, but a high
personal tax-to-GDP ratio, as seen in Figure 1.
Figure 1: Australia has a high reliance on personal income tax compared to other economies

Source: OECD Global Revenue Database, 2022.
Note: Data is for 2019 and includes revenue from all sources at all levels of government, including social security contributions. ‘Personal income tax’ revenue includes taxes on income, profits, and capital gains of individuals, but does not include social security contributions, superannuation contributions, nor direct taxes on wealth.
While there are limitations to cross-country comparisons – for instance, social security contributions are included in the OECD definition of total tax revenue while superannuation contributions are not – the results show that Australia is more reliant on revenue from personal taxes compared to other OECD economies. For Australia’s second-largest source of revenue, consumption taxes, other OECD economies raise about 50% more revenue from this source than Australia does.
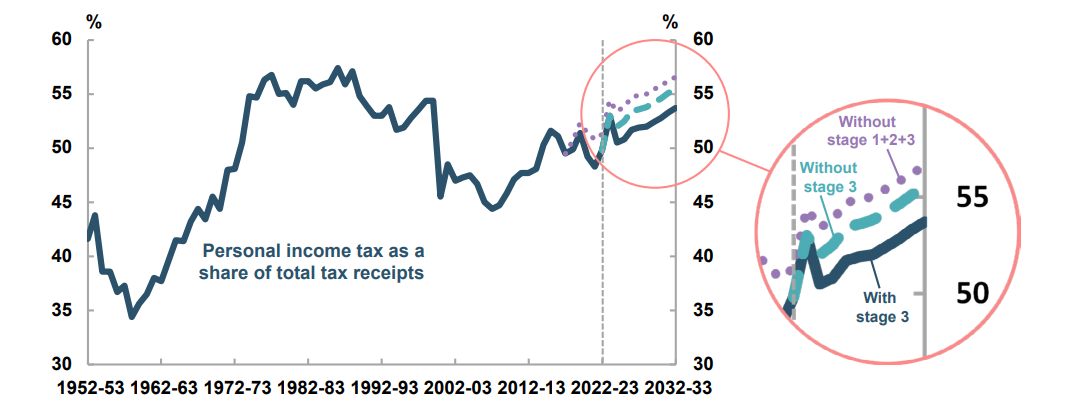
The Australian Government relied on personal tax for more than 50% of its revenue between the early 970s up until the introduction of the GST in 2000-01 (Figure 2), when the share fell below 50%, not only because of the new tax but because personal taxes were cut. Since then, the share of tax receipts from individuals has been trending back towards pre-GST levels. This is mostly due to bracket creep, which occurs when rising incomes cause individuals to pay an increasing proportion of their income in tax, even though tax settings may not have changed.
The PBO projects personal income tax to make up to nearly 54% of total tax receipts by 2032-33,
higher than at any time since the introduction of the GST, and close to the average between 1973-74 to
1999-2000
Figure 2: Personal income tax will continue to rise as a share of total tax receipts

Source: 2022-23 October Budget, PBO historical fiscal data, 16% sample of 2018-19 tax file data, PBO analysis
Equity: Bracket creep reduces progressivity in the personal tax system Australia has a progressive personal income tax system, with different rates of tax payable according to income (that is, capacity to pay). A simple measure of progressivity is to consider the share of tax paid by the top 10% of earners, and how that has changed over time3.
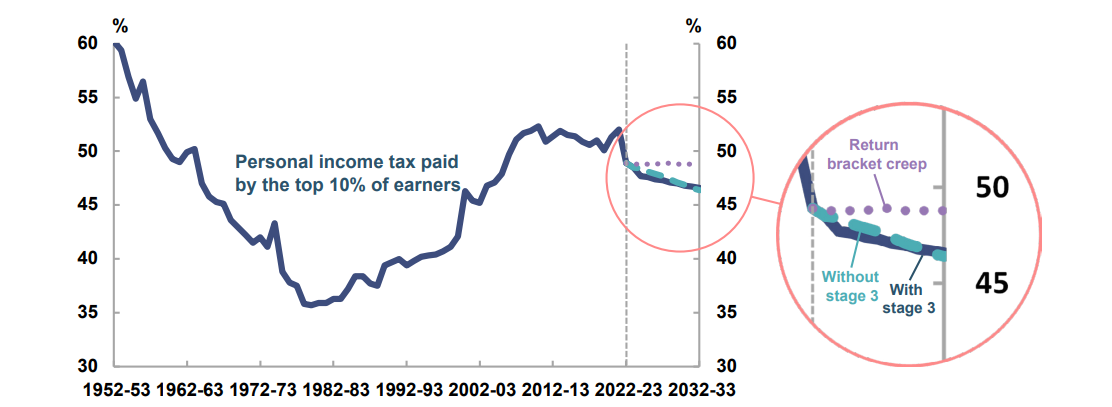
The share of tax paid by the top 10% has varied greatly since the 1950s. Figure 3 shows that this share
declined from over 60% in the early 1950s to below 40% in the 1980s. This was primarily due to bracket
creep – low and middle-income earners began paying a lot more tax as their wages grew, reducing
the share paid by those at the top.
In 2021-22, the top 10% paid 52% of personal income tax, a little bit higher than the decade before and
considerably higher than in the 1980s and 1990s. But with the end of the Low and middle income
tax offset in 2021-22, the share is expected to fall below 50% in 2022-23, and decline to around 47% by
2032-33, primarily due to bracket creep.
Figure 3: Share of personal tax paid by the top 10% of earners

Source: Historical distributional tax data from ATO Taxation statistics, 16% sample of 2018-19 tax file data, PBO analysis.
Note: ‘Return bracket creep’ represents a scenario where taxes are cut each year to reverse the impact of bracket creep.
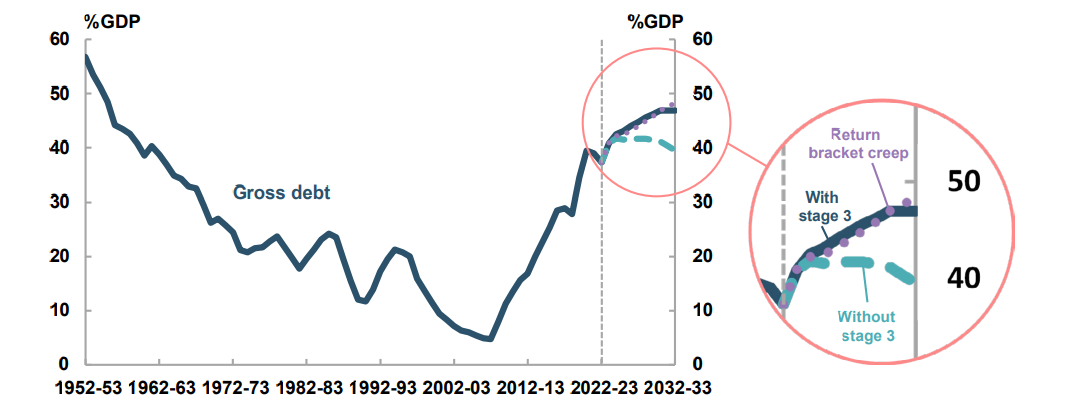
Sustainability: Debt-to-GDP would continue trending upwards without bracket creep Bracket creep has often been an important component of repairing the budget position and reducing the debt-to-GDP following adverse shocks (Figure 4). With the October 2022-23 Budget showing ongoing deficits, by how much is bracket creep expected to contribute to the budget balance over the next decade?
If taxes were cut every year to fully offset the impact of bracket creep, starting in 2023-24, this would cost around $310 billion over the period to 2032-33 (compared to a scenario where the 2022-23 tax settings are held constant). The legislated stage 3 tax cuts in 2024-25, which cost around $250 billion over the period to 2032-33, offset some of the impact of bracket creep, but do not eliminate it completely – bracket creep will still continue even after taxes are cut. Gross debt is projected to largely stabilise around 2032-33, but would continue increasing without bracket creep, without other policy changes.
Figure 4: Debt-to-GDP begins to stabilise around 2031-32 mainly due to bracket creep

Source: PBO historical fiscal data, 16% sample of 2018-19 tax file data, PBO analysis.
Note: ‘Return bracket creep’ represents a scenario where taxes are cut each year to reverse the impact of bracket creep.
Relying on bracket creep to contain the growth in debt is one approach to fiscal repair. But it would come at a cost of reduced efficiency and equity in the tax system, with personal tax as a share of tax receipts rising towards historic highs, and the top 10% of earners paying a reduced share of tax. Other approaches would be to reduce expenses, expand other sources of revenue, or rely on strong economic growth. See PBO’s Fiscal Sustainability for further discussion.
- Bracket creep is a situation where income growth causes individuals to pay a higher portion of their income in tax.
- The Henry tax review (Australia’s Future Tax System Review Final Report | Treasury.gov.au) identified five principles of good tax design: equity, efficiency, simplicity, sustainability and policy consistency
- This is not the only way to measure progressivity but has been chosen for its conceptual simplicity. A full assessment of progressivity and equity would include both the tax and transfer system. ‘Earners’ refers to those submitting a tax file and recording some amount of positive income, including those earning below the tax-free threshold.
PBO Seminar: Trends in personal income tax
Budget Insights | Dr Cameron Chisholm | 15 March 2023