The Commonwealth Government’s fiscal position is projected to improve over the decade, but the impact of the COVID-19 pandemic remains profound and uncertain
Beyond the budget provides independent projections of key budget outcomes such as debt and the budget balance over the next decade and assesses fiscal sustainability over the next forty years.
The challenge of reducing debt from post-war record levels will depend on factors such as the performance of the economy, interest rates and successful budget repair. Beyond the budget explores multiple scenarios for longer-term government debt, based on various assumptions for these factors, rather than a single case.
Starting at around 50 per cent of GDP in 2031-32, gross debt is projected to fall steadily to the early 2060s under all but our most unlikely worst scenarios.
The Commonwealth’s fiscal position can remain sustainable over the longer term even if the government continues to run modest deficits
These results do not require governments to achieve budget surpluses, nor do they require interest rates to remain at their current low levels. Future governments will need to act to ensure sustainability, but if they act consistently and early, they do not need to consolidate more rapidly than after previous downturns.
Our conclusion that the fiscal position can remain sustainable is measured against the fact that government debt matters and that the quality and efficiency of public spending, whether for services or investments, are crucial. Our conclusion also reflects the fact that, because our scenarios are based on historical precedents, including the frequency and severity of economic shocks, it would be more difficult for Australia to maintain a fiscally sustainable position if future shocks are consistently larger or more frequent.
Beyond the budget also considers important influences on the projections, including personal income taxes, the National Disability Insurance Scheme, and the longer-term fiscal impacts of lower net overseas migration.
Structural increases in payments are projected to more than offset the improvements to receipts
The Parliamentary Budget Office projects underlying cash deficits to persist, but decline over the medium term, from 2.5 per cent of GDP in 2025-26 ($63 billion) to 1.5 per cent ($52 billion) in 2031-32. Total receipts are projected to reach 24.7 per cent of GDP ($847 billion) in 2031-32— slightly lower than their pre-pandemic 2018-19 level of 24.9 per cent. Although near-term outcomes for payments will be higher than estimated in the 2021-22 Budget, an improving health and economic situation would still see them falling over time as a share of the economy and as temporary assistance unwinds.
Our modelling projects total payments to increase over the medium term relative to last year’s projections, and to more than offset the upwards revision to receipts by 2030-31. These revisions to payments are largely unrelated to economic recovery or to the lingering effects of the COVID-19 pandemic, but are driven primarily by higher projected payments for large and growing programs such as the National Disability Insurance Scheme and, to a lesser extent, aged care
1 About this report
- The Parliamentary Budget Office’s (PBO’s) Beyond the budget 2021-22: Fiscal outlook and scenarios provides independent projections of key budget outcomes such as debt and the budget balance over the next decade and assesses fiscal sustainability over the next forty years.
- Because there is a high degree of uncertainty around longer-term projections, we use techniques such as sensitivity and scenario analysis to explore a range of plausible futures instead of just one central scenario
This report1 has two key objectives:
- to provide independent, detailed projections of the government’s balance sheet, budget balance, receipts and payments over the medium-term projections period (2025-26 to 2031-32)2. These projections inform questions such as ‘If current government policy continued over the next decade, what would the impacts on the budget balance and balance sheet be?’
- to assess longer-term fiscal sustainability, defined here as the government’s ability to maintain its long-term fiscal policy arrangements indefinitely, without the need for major remedial policy. We explore the question ‘If the government maintains a budget balance broadly in line with historical precedents, is the fiscal position sustainable over the longer term (to 2060-61)?’
These two different objectives and time periods mean two different analytical approaches are appropriate. Figure 1-1 summarises the approach, assumptions, and inputs for each part of the report. The PBO is an independent agency of the Parliament. When undertaking analysis, we use assumptions about economic variables (Gross Domestic Product, inflation and so on) from the government, but use our own fiscal models and professional judgement to translate these into fiscal projections and scenarios.
The PBO’s central projections are based on the policy settings, budget estimates and economic parameters at the time of the 2021-22 Budget and so do not reflect developments since that budget, such as additional COVID-19 payments due to lockdowns. While shocks such as new strains of COVID-19 could put Australia and the world on a different path, if the current health situation improves broadly as expected at the time of writing, the projections in this report give a useful indication of the impact of current government policies over the decade ahead, and a baseline from which different outcomes can be explored. The PBO uses a number of techiques to shed light on how variation in important but uncertain parameters such as economic growth and interest rates might affect our results. Box 1 discusses these issues further.
|
Box 1: Interpreting fiscal projections and scenarios in a period of heightened economic uncertainty The PBO’s projections start from 2025-26, taking the results for 2021-22 to 2024-25—the ‘forward estimates period’—directly from the budget as per our legislation. Like all modelling, the economic estimates in the budget depend on assumptions. Outcomes can be very different from forecasts, depending on whether the key assumptions have held in the period. Some of the key assumptions underpinning the economic forecasts in the May 2021 Budget have not come to pass, due to outbreaks of COVID-19 and subsequent health and economic restrictions. The Reserve Bank of Australia (RBA) now expects growth in the September quarter to contract noticeably as a result.3 The RBA expects the Australian economy to bounce back once restrictions ease. Under the baseline scenario from the August 2021 Statement on Monetary Policy, GDP and employment are expected to have returned to their paths in the RBA’s May Statement by early next year.4 The implication for interpreting projections in this report is that, provided the health situation in Australia improves broadly as expected, our results give an indication of the impact of current government policies over the decade ahead. As is always the case for projections over longer time horizons, readers should pay more attention to the projected trajectories for key variables and their relative sizes, rather than to the exact numerical estimates. In this report we use several techniques to explore the uncertainty around our projections and illustrate how important some key inputs are for the outcomes.
|
| Figure 1-1: Beyond the budget: summary of approach, inputs and assumptions |
The PBO continuously seeks to enhance and expand its analysis over time. In this edition, there are three new elements:
- An updated assessment of fiscal sustainability beyond the medium term, drawing on inputs from the 2021 Intergenerational Report.
- A more detailed framework for projections of key balance sheet variables to provide a comprehensive picture of the government’s financial outlook, including independent estimates for public debt issuance and interest payments.
- Reporting of budget aggregates on an accrual basis (using the fiscal balance) in addition to the cash basis (using the underlying cash balance).
The rest of this report is structured as follows:
- Chapter 2 presents projections for key elements of the government’s balance sheet over the medium term including gross and net debt, net financial worth, and net worth, and discusses risks to the government’s balance sheet.
- Chapter 3 assesses fiscal sustainability beyond the medium term, exploring the longer-term implications of different scenarios for economic growth, the budget balance and the gross debt projections introduced in Chapter 2.
- Chapter 4 examines budget balance aggregates and some key trends and drivers of the budget position. It presents projections for the underlying cash and fiscal balances and total receipts and payments, as well as analysis of personal income tax distribution, migration, and the National Disability Insurance Scheme (NDIS).
- Chapter 5 provides detailed estimates for individual receipts and payments programs.
An accompanying paper, the Beyond the budget 2021-22: Supplementary paper, provides further information on the approach to the report and additional results. Data for all the charts and tables in the report, as well as some additional downloads, are available on the PBO data portal and on data.gov.au.5
2 Balance sheet projections
- The PBO projects gross debt to peak at around 50 per cent of GDP in 2028-29 before falling slightly to the end of the medium term. Net debt as a share of GDP is projected to fall slightly over the medium term to reach around 38 per cent by 2031-32, reflecting decreasing budget deficits as a share of GDP as receipts continue to recover.
- After deteriorating over the forward estimates period, we project net financial worth and net worth to improve to -41 and -32 per cent of GDP respectively by the end of the medium term.
- These projections assume, consistent with the budget, that interest rates rise steadily from their historically low levels from 2025-26. Even with these assumed increases, interest payments are likely to remain manageable.
Fiscal sustainability is a function of the starting point and the direction of change. The starting point at any one time is the government’s balance sheet. This chapter presents projections for balance sheet aggregates over the next decade, including gross and net debt. The next chapter combines these medium-term projections with a higher-level view of the following thirty years, to assess the longer-term sustainability of the government’s fiscal position
The government’s balance sheet is a list of its accumulated assets and liabilities at a specific point in time. Balance sheet projections show how these assets and liabilities might evolve in the future. While public discussion of the budget often concentrates on the level of surplus or deficit in a particular year as measured by the underlying cash balance, we don’t know the significance of those surpluses or deficits without knowing the state of the balance sheet. The balance sheet and its components are important for developing a clearer picture of the government’s financial position.
- Balance sheet aggregates are important when considering whether the government’s fiscal position is sustainable over the longer term. These aggregates include measures such as gross and net debt, and also those that provide a broader picture of the government’s collective financial wealth such as net financial worth and net worth.
- Some important elements of the government’s financial position are included in the balance sheet, but not in common measures of the government’s budget balance such as the underlying cash balance. For example, changes in the value of government loans and equity investments are only visible in net financial worth on the government’s balance sheet.6
Budget deficits and surpluses depend on the economy and government policy decisions, and affect the balance sheet through their impact on government debt. As discussed in Box 1 in Chapter 1, the health and economic assumptions underpinning the most recent budget and these projections have not all transpired in the short term, with much of Australia’s population under restrictions over recent months. This naturally raises the question of how much impact these restrictions, and consequent larger budget deficits, might have on the balance sheet. Box 2 presents some sensitivity analysis, looking at the impact of different deficits and interest rates on our debt projections. These uncertainties are explored further in the next chapter on longer-term fiscal sustainability.7
2.2.1 Gross debt, net debt and interest payments
In this report we use PBO projections for both gross and net government debt.
- In the budget papers, gross debt measures the value of Australian Government Securities (‘government bonds’) on issue.
- Net debt adjusts the gross value of interest-bearing liabilities for the value of selected interest-bearing assets.
- In the gross debt calculation, government bonds are priced at their value when issued (their 'face value'), while in the net debt calculation, they are priced at the value they are currently trading at (their 'market value').
Net debt gives a better picture of the government’s financial position than looking only at gross debt, however, the two have generally moved in a similar way over time so the fiscal sustainability analysis in the next chapter uses gross debt for simplicity.
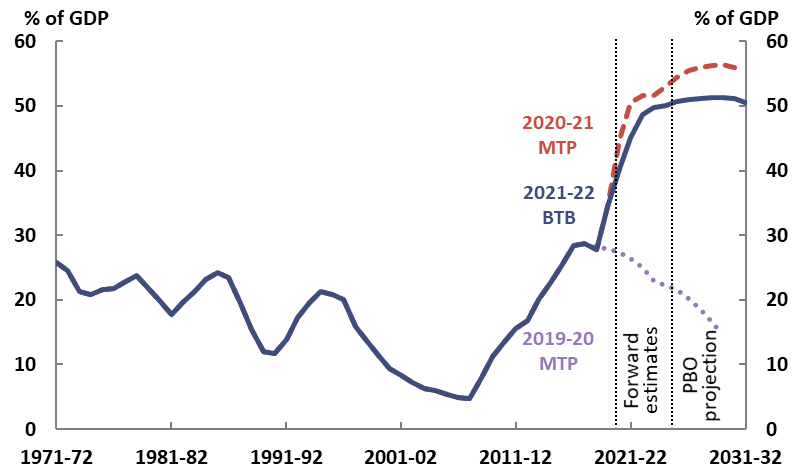
The PBO projects gross debt to peak at around 50 per cent of GDP in 2028-29 before falling slightly towards the end of the medium term (Figure 2-1). Growth in nominal GDP is projected to exceed the interest rate on debt, resulting in debt as a share of GDP stabilising despite the projected persistence of underlying cash deficits.
The 2021-22 Budget estimates that gross debt as a share of GDP will be lower in each year of the forward estimates than estimated in the 2020-21 Budget, due to decreased borrowing requirements resulting from lower-than-expected cash deficits. The PBO projects gross debt as a share of GDP to continue to be lower in each year over the medium term when compared to last year’s projections, mainly due to an increase in projected economic growth. However, gross debt is significantly higher when compared to pre-pandemic levels, when it was projected to fall to around 15 per cent of GDP by 2029-30 before the pandemic.8
While derived from the PBO’s own set of models, gross debt and other medium-term projections in this report are broadly consistent with those presented in the 2021-22 Budget (Box 3).
|
Box 2: How much might higher deficits and bond yields affect future debt? There is a high level of uncertainty around the economy in the near term and therefore about the implications for budget outcomes. With several states and territories in lockdown, the budget deficit over the next couple of years may be larger than forecast in the Budget. We explore the sensitivity of our debt medium-term projection to the near-term economic forecasts using the downside scenario from the RBA’s August 2021 Statement on Monetary Policy. This scenario assumes that around half of the Australian population experiences rolling lockdowns during both the September and December quarters of 2021, and that a full opening of international borders is delayed until later in 2022.9 The economic forecasts in this scenario are also lower than the forecasts in the 2021-22 Budget. The impact on the budget balance and debt arises from two main channels: lower receipts, and (potentially) higher payments. We use two hypothetical illustrative cases for payments, which should not be interpreted as reflecting current or future government policy. With no additional payments, applying a rule of thumb translation to the economic scenario, the underlying cash balance could be around $25 billion lower in both 2021-22 and 2022-23 than forecast in the 2021-22 Budget, driven by lower tax receipts.10 This would lead gross debt as a share of GDP to be almost 2 percentage points higher in 2031-32 compared to our projection for gross debt as a share of GDP which is based on the Budget economic forecasts. That is, gross debt is projected to be about 52 per cent rather than 50 per cent in 2031-32. If the government were to provide total additional payments of $50 billion in 2021-22, such that the underlying cash balance could be around $75 billion lower (further in deficit) in 2021-22 and $25 billion lower in 2022-23, gross debt as a share of GDP is projected to be around 4 percentage points higher in 2031-32 than in our projection. Yields (interest rates) on government bonds also affect the size of the budget deficit because they reflect the rate at which governments can borrow money. While yields are expected to rise from their historic lows, there is uncertainty around when this might happen. For example, with the economic situation currently worse than forecast at Budget, bond yields could remain low for longer than expected. On the other hand, bond yields could rise faster than expected, for example if financial markets were to increase their expectations for future inflation. Statement 8, Budget Paper 1 of the 2021-22 Budget presents a sensitivity analysis on alternative pathways for yields. In this sensitivity analysis, the lower yield assumption is that the 10-year bond yield remains flat over the entire 11-year period rather than rising after four years. Compared with the Budget projections, this assumption would lead to a slight improvement to the underlying cash balance over the medium term. These cumulative improvements to the underlying cash balance would reduce gross debt by around 2 percentage points of GDP in 2031-32, with a more significant improvement beyond the medium-term period. Under the higher yield assumption, 10-year bond yields converge immediately over five years to the long-run yield rate of around 5 per cent. Compared with the Budget projections, this would lead to a deterioration in the underlying cash balance of around 1.0 percentage point of GDP by 2031-32, and gross debt is projected to be around 6.3 percentage points of GDP higher in 2031-32. Changes to budget balances and borrowing costs are likely to occur together, rather than in isolation, so the changes to underlying cash balance presented here should not be interpreted as projections, but rather as indicative of the magnitude of the effect that each factor could have on government debt levels. |
| Figure 2-1: Gross debt |
| 1971-72 to 2031-32 |
 |
|
Note: ‘MTP’ refers to PBO’s previous medium-term projections reports. ‘BTB’ is short for Beyond the budget. Source: 2019-20, 2020-21 and 2021-22 Budget and PBO analysis. |
|
Box 3: How do the PBO’s results compare with the Budget? The PBO’s projections over the next decade in Chapters 2 and 4 of this report are broadly consistent with those presented in the 2021-22 Budget. While derived from an independent suite of models, the PBO’s projection for the underlying cash balance from 2025-26 to 2031-32 do not differ significantly from those in the budget. As a result, the various projections for gross and net debt, and net financial worth are also similar. By contrast, the budget papers do not publish medium-term projections for individual receipts and payments items, which we present here in Chapter 5. Table 1-1 in the supplementary paper to this report compares the aim, inputs, assumptions and modelling approach of the budget and this report, as well as the Intergenerational Report. |
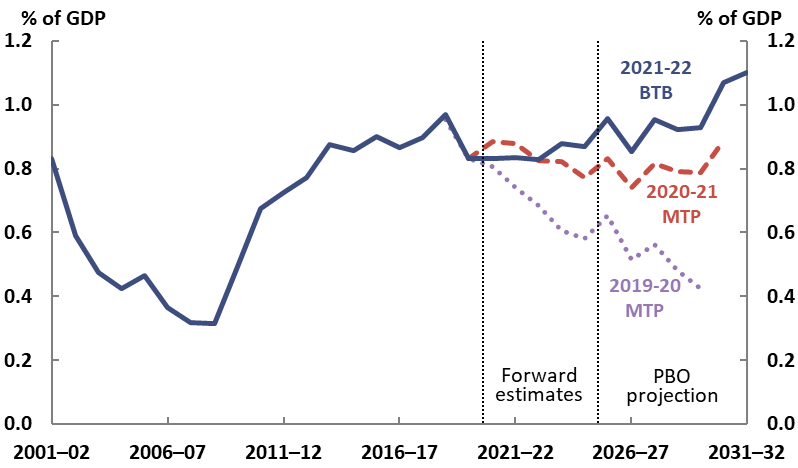
Interest payments are projected to increase but remain manageable over the medium term, from 1.0 per cent of GDP in 2018-19 to 1.1 per cent of GDP in 2031-32 (Figure 2-2). This reflects both the increase in debt, and a small increase in interest rates on debt (yields) over the decade, although these are projected to stay at low levels. The assumed market yield for the 2021-22 Budget is a weighted average cost of borrowing of around 1.6 per cent over the forward estimates period, compared to around 0.8 per cent assumed in the 2020-21 Budget.
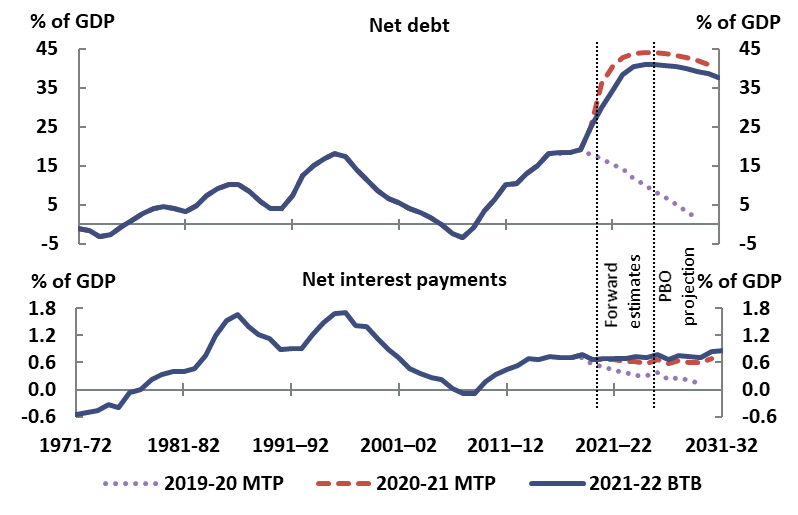
Net debt as a share of GDP is projected to fall slightly over the medium term, reflecting decreasing budget deficits as receipts continue to recover. By the end of the medium term, net debt is projected to be 37.7 per cent of GDP ($1,292 billion) (Figure 2-3).
| Figure 2-2: Interest payments |
| 2001-02 to 2031-32 |
 |
|
Note: Previous medium-term projections reports have used a slightly different definition of interest payments. This current approach has been retrospectively projected in this report for comparison. The small volatility in the projections for interest payments reflects the different dates at which various bonds mature and need to be re-financed. In practice, debt issuance would be managed such that this variability would be smaller. Source: 2019-20, 2020-21, 2021-22 Budget and PBO analysis |
|
Figure 2-3: Net debt and net interest payments |
| 1971-72 to 2031-32 |
 |
| Note: Net interest payments are equal to total interest payments less interest receipts. |
| Source: 2019-20, 2020-21 and 2021-22 Budget and PBO analysis. |
As with gross debt, the government’s net debt position has improved. Over the four years to 30 June 2024, the 2021-22 Budget revised net debt down by $279.3 billion, because lower-than-expected underlying cash deficits would require less debt issuance than previously projected and also because of a decrease in the market value of debt as interest rates rise.11 The PBO projects net debt to be lower in both dollar terms and as a share of GDP in each year over the medium term, for the same reasons. While the outlook for net debt has improved, it is significantly higher when compared to the pre-pandemic projections. For example, in our 2019-20 medium-term projections report, we had projected net debt to be close to zero in 2029-30.
2.2.2 Net financial worth and net worth
Net financial worth and net worth are two broader measures of the balance sheet; we project that both will improve over the medium term.
- Net financial worth is a broader measure of the strength of the government’s balance sheet than net debt, because it includes all the Commonwealth’s financial assets and liabilities, including the unfunded superannuation liability and equity investments.
- The broadest measure of the Government’s financial position is net worth. It is the sum of all assets less all liabilities, including non-financial assets such as land, buildings and equipment.
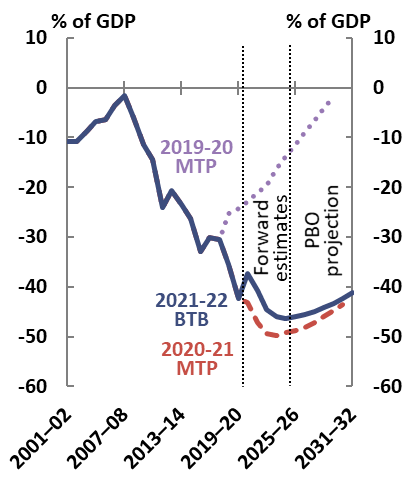
Over the forward estimates, the government estimates that net financial worth to fall from -40.8 per cent of GDP (-$870.6 billion) in 2021-22 to -46.4 per cent of GDP (-$1,111.4 billion) in 2024-25 (Figure 2-4). This reflects the government’s increasing borrowing requirements to fund the response to the COVID-19 pandemic. The PBO projects net financial worth to improve over the medium term to -41.2 per cent of GDP ($1,412.6 billion) in 2031-32.
Net worth shows a similar trajectory to net financial worth. The 2021-22 Budget estimates that net worth will worsen from -31.8 per cent of GDP (-$678.0 billion) in 2021-22 to -37.2 per cent of GDP (-$891.4 billion) in 2024-25 (Figure 2-5). By the end of the medium term, the PBO projects net worth to improve to -32.0 per cent of GDP ($1,098.2) in 2031-32.
The deterioration in net worth over the forward estimates period and the subsequent improvement over the medium term reflect the same drivers that impact on net debt and net financial worth.
| Figure 2-4: Net financial worth | Figure 2-5: Net worth |
| 2001-02 to 2031-32 | 2001-02 to 2031-32 |
 |
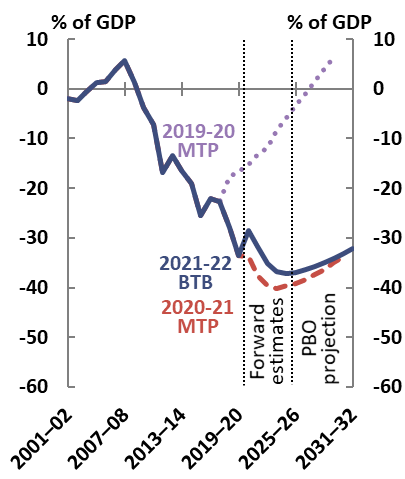 |
Note: Negative values indicate that relevant liabilities exceed relevant assets, so moving from a larger to a smaller negative number represents an improved financial position.
Source: 2019-20, 2020-21 and 2021-22 Budget and PBO analysis.
Balance sheet aggregates like net debt are made up of different components of the overall balance sheet. This means that, to understand risks around the aggregates, we can drill down another level to look at what influences the value of their component parts. Figure 2-6 shows the main components of the Commonwealth’s balance sheet as at 30 June 2020.
Liabilities are dominated by two categories: Australian Government Securities make up nearly 60 per cent, and superannuation liabilities around 30 per cent. The main drivers of the value are the size of the annual budget deficits, which determine the stock of bonds on issue, and the government’s cost of borrowing (bond yields). The sensitivity of the value of the debt liability to budget deficits and bond yields was discussed in Box 2; the next chapter extends this analysis over the longer term using a scenarios approach to assess fiscal sustainability.
The composition of the government’s assets is more varied.
Over half of the government’s financial assets fall into three categories: the six Commonwealth Investment Funds including the Future Fund, student loans including the Higher Education Loan Program (HELP) and Vocational Education and Training (VET) student loans, and investments in the National Broadband Network (NBN).
This composition is not readily visible in the budget’s financial statements alone because these are generally presented by the type of asset, rather than the program or entity which has made them. For example, investments made by the Future Fund appear in the Commonwealth’s financial statement under their relevant asset class—such as ‘investments, loans and placements’ and ‘equity investments’—without being identified as Fund assets.
Taking a more ‘program based’ view of assets may help when considering the risks and drivers of the underlying asset valuations. For example, each Commonwealth Investment Fund has its own investment mandate specifying the benchmark rate of return, risk appetite, and so on. Individual major investments such as the NBN have drivers specific to those investments, such as the dynamics and policy settings of Australia’s telecommunications markets.
The PBO plans to publish more work on the balance sheet in future, including further analysis of the drivers of and risks to the valuation of material assets and liabilities.
| Figure 2-6: Commonwealth Government assets and liabilities |
| As at 30 June 2020 |
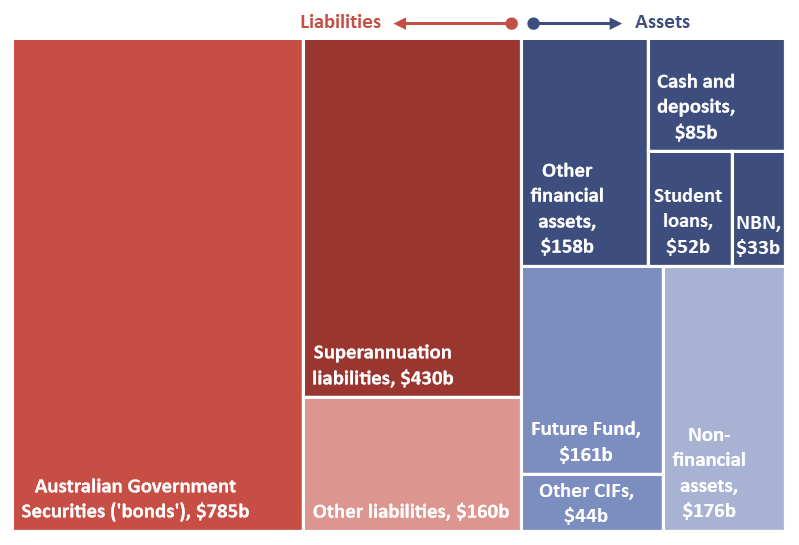 |
| Note: Data are as at 30 June 2020 as this is the date of the most recent NBN valuation (and therefore most recent date for which all valuations are available). Other CIFs refers to ‘Other Commonwealth Investment Funds’ and comprise the Medical Research Future Fund, the DisabilityCare Australia Fund, the Future Drought Fund, the Emergency Response Fund and the Aboriginal and Torres Strait Islander Land and Sea Future Fund. ‘NBN’ includes both loans and equity investments for the NBN. ‘Cash and deposits’ comprises of the categories ‘Cash and deposits’ and ‘Investments – deposits’. Australian Government Securities include Treasury Bonds, Treasury Notes, and Treasury Indexed Bonds. ‘Other liabilities’ includes additional employee liabilities, lease liabilities, loans, and provisions and payables. In the Final Budget Outcome, from which this value is taken, the value of ‘Superannuation liabilities’ is calculated using the spot rates on long-term government bonds as at 30 June 2020 that best match the duration of liabilities for each relevant individual government superannuation scheme. These rates are currently lower than the discount rate used in budgets papers to value estimates of the liability, which leads to higher valuations in Final Budget Outcomes than in budget estimates (see 2019-20 Final Budget Outcome, p.14). |
| Source: 2019-20 Final Budget Outcome, Department of Infrastructure, Transport, Regional Development and Communications 2019-20 Annual Report, and PBO analysis. |
3 Fiscal sustainability
- Our scenarios for future economic growth, interest rates and the budget balance over the next 40 years show government debt as a share of the economy falling or remaining broadly unchanged in almost 90 per cent of our cases—even if the government continues to run modest deficits.
- This does not mean that government debt does not matter, nor does it mean that the quality and efficiency of public spending, whether for services or investments, is not crucial.
- Governments need to act to ensure sustainability, but if they act consistently and early, their actions need only to be consistent with those of the past, including earlier periods of reform. If they act inconsistently, or late, governments may need to take actions which go beyond historical experience.
- Our scenarios are based on historical averages, so they incorporate the impact of future shocks to the extent that these are, on average, as large and frequent as those of the past.
The previous chapter used the balance sheet to show the starting point for assessing the fiscal position of government. This chapter takes a longer-term look at debt and the sustainability of the government’s fiscal position in order to understand how that starting point will change over time. To do that, we take a high-level approach to extending the debt projections from the previous chapter over an additional three decades, exploring the longer-term implications for public debt of different scenarios for economic growth, the budget balance and for the government’s cost of borrowing.
This report provides the first in a series of annual PBO assessments of fiscal sustainability over the longer term, which will apply and extend the framework set out in the PBO report Fiscal sustainability.12
We define fiscal sustainability as the government’s ability to maintain its long-term fiscal policy arrangements indefinitely, without the need for major remedial policy action. A fiscally sustainable position enables the private sector to make financial decisions with confidence about the direction of government policy, helps the government achieve its objectives and gives it space to respond to an economic downturn by stimulating the economy, if needed, or to alleviate long-term funding pressures (for example due to population ageing). An actual or perceived unsustainable fiscal position has the potential to undermine this confidence and to reduce the government’s capacity to respond effectively to future downturns.
Based on this definition, we assess fiscal sustainability by examining multiple possible future paths for gross debt relative to GDP.13 The fiscal position is sustainable under a particular scenario if the trajectory of gross debt is broadly stable or falling towards the end of the scenario period. Rather than presenting one ‘central’ projection, we use a scenario approach to explore fiscal sustainability under a range of possible futures. We model 27 different scenarios which reflect plausible variations in three key drivers of debt: interest rates, nominal (dollar value) economic growth and the budget balance, based on historical precedents. We cannot know which scenario is most likely, but our judgement is that our ‘best case’ and ‘worst case’ are very unlikely as in each of those cases, each of the three factors would have to be at their best (or worst) at the same time—including continually high interest rates and low economic growth (or vice versa). We do not have recent evidence for such circumstances to endure at the same time.
Table 3-1 outlines our three key drivers of fiscal sustainability and their impacts on gross debt.
| Table 3-1: Fiscal sustainability assessment: key drivers and impact on gross debt |
| Note: Budget balance variable is headline cash balance, which directly affects the level of gross debt, rather than the underlying cash balance, which does not include items such as asset sales and purchases. Our scenarios vary the headline cash balance excluding interest payments (sometimes referred to as the ‘primary balance’), because interest payments are captured in the interest rate component of the modelling. |
| Source: PBO analysis. |
Our scenarios for these three drivers help us to explore their impact on debt and the fiscal position.
- Interest rates rise significantly from their current historically low rates under all scenarios. Interest rates are currently around historically low levels, raising the question of how important interest rate risk is for longer term fiscal sustainability. In our middle interest rate scenarios, rates rise to a weighted average yield of around 5 per cent (converging with the middle scenario assumption for nominal GDP growth) over a 15-year period from 2025-26 to 2039-40. The upside and downside values are based on the same variance as the relevant GDP growth scenarios, reaching ± 0.6 per cent by the end of the scenario period.
- Our GDP scenarios incorporate different paths for important drivers such as productivity.
Future economic growth is dependent on growth in the population, productivity and participation rates. For cyclical variables, such as productivity, we implicitly account for peaks and troughs of historical economic cycles by taking a long-run average approach. For example, the upside productivity scenario mirrors the productivity boom of the early 1990s while the downside productivity scenario mirrors the recent low productivity levels.14 - Our middle and downside scenarios assume sustained modest budget deficits, informed by historical precedent. Our middle and downside scenarios are in deficit over the scenario period if interest payments are incorporated, while the upside scenarios incorporate a gradual transition to surplus after the end of the medium term.
Beyond the medium term, the scenarios implicitly incorporate the assumption that government policy changes over time in order to maintain the budget position—just as successive governments have, over time, adjusted policy settings as circumstances change. This approach differs from that taken by the Intergenerational Report, in particular.
There are important differences in the methodology and the intention of our analysis compared to the Intergenerational Report.
The Intergenerational Report is guided by the question, ‘How might the fiscal position evolve under current policy settings?’. Our scenarios are guided by the question, ‘If the government maintains a budget balance broadly in line with historical precedents, is the fiscal position sustainable?.’ This means we assume that government policy changes over time in order to maintain the budget position.15
The results of all 27 of our scenarios for the gross debt-to-GDP ratio are available in the chart data published with this report and the PBO Data Portal.16 The PBO is developing an online fiscal sustainability dashboard as a visual guide to the key drivers and results of our fiscal sustainability assessment, to be released later this year.
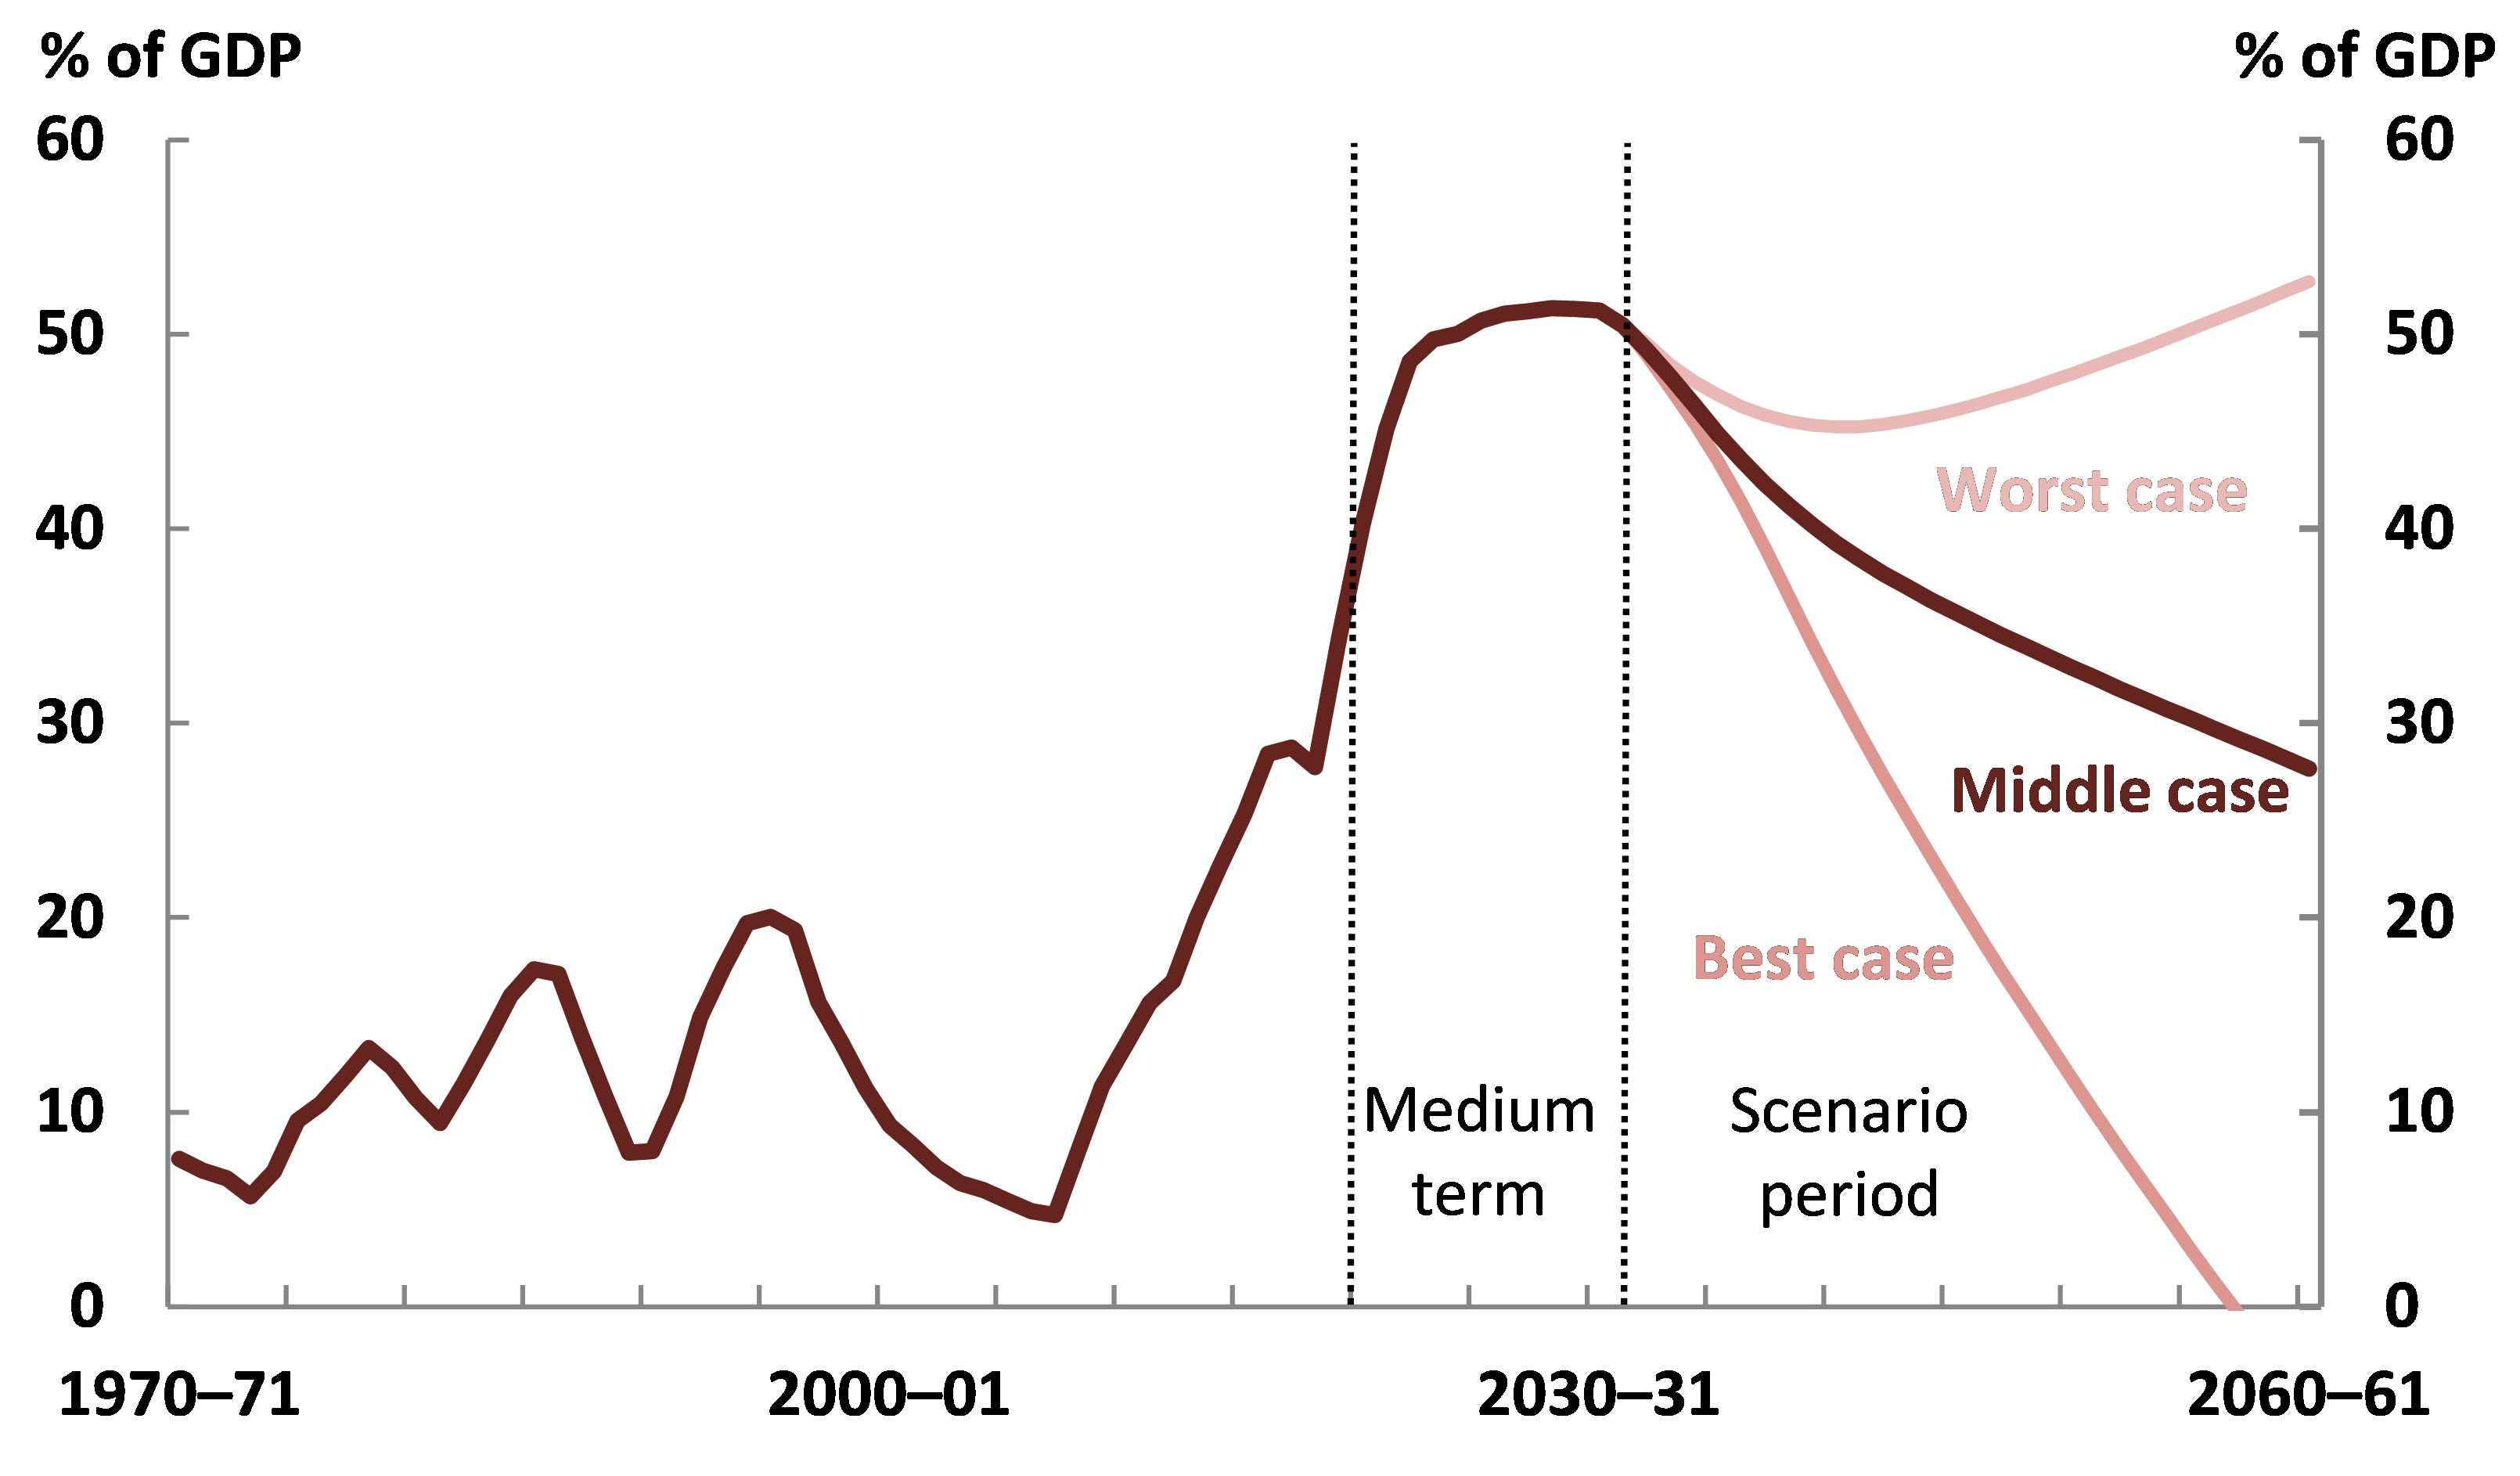
Our scenarios show that Australia should be able to sustainably maintain its debt over the next 40 years, provided economic shocks and the government’s fiscal strategies are both broadly similar to those of the past. The falling debt-to-GDP ratio under most of the scenarios illustrates that fiscal sustainability is not dependent on achieving a balanced budget, nor on interest rates remaining at their current low levels. This holds for the ‘middle’ as well as for the majority of our ‘downside’ scenarios, even though these assume continuing budget deficits and rising interest rates.
Figure 3-1 shows the debt-to-GDP ratio for three of these scenarios. The middle case scenario reflects the budget’s baseline assumptions for interest rates and GDP growth, and the long-term average budget deficit. In this scenario gross debt continues to fall steadily over the scenario period. Our ‘best case’ scenario (low interest rates, high GDP growth and small budget surpluses over the scenario period) leads to the elimination of gross debt by the late 2050s. Three of our 27 scenarios, including our ‘worst case’ scenario (high interest rates, low GDP growth and a higher-than-average budget deficit), show gross debt initially falling before increasing, to be back around the medium-term peak by 2060-61 under the worst case. 17
| Figure 3-1: Gross debt to GDP stabilises across a broad range of scenarios |
| 1970-71 to 2060-61 |
 |
| Source: 2021-22 Budget and PBO analysis. |
The main driver of the debt reduction is the historically low interest rates on debt issued in recent years, which will mature over the next twenty to thirty years, together with the expectation that interest rates are likely to remain low for the next decade. Even though the interest rate on new debt issued under the middle scenario converges with GDP growth, the average interest rate on all outstanding debt remains lower than GDP growth for a number of years, as the long-term bonds issued at lower rates mature.
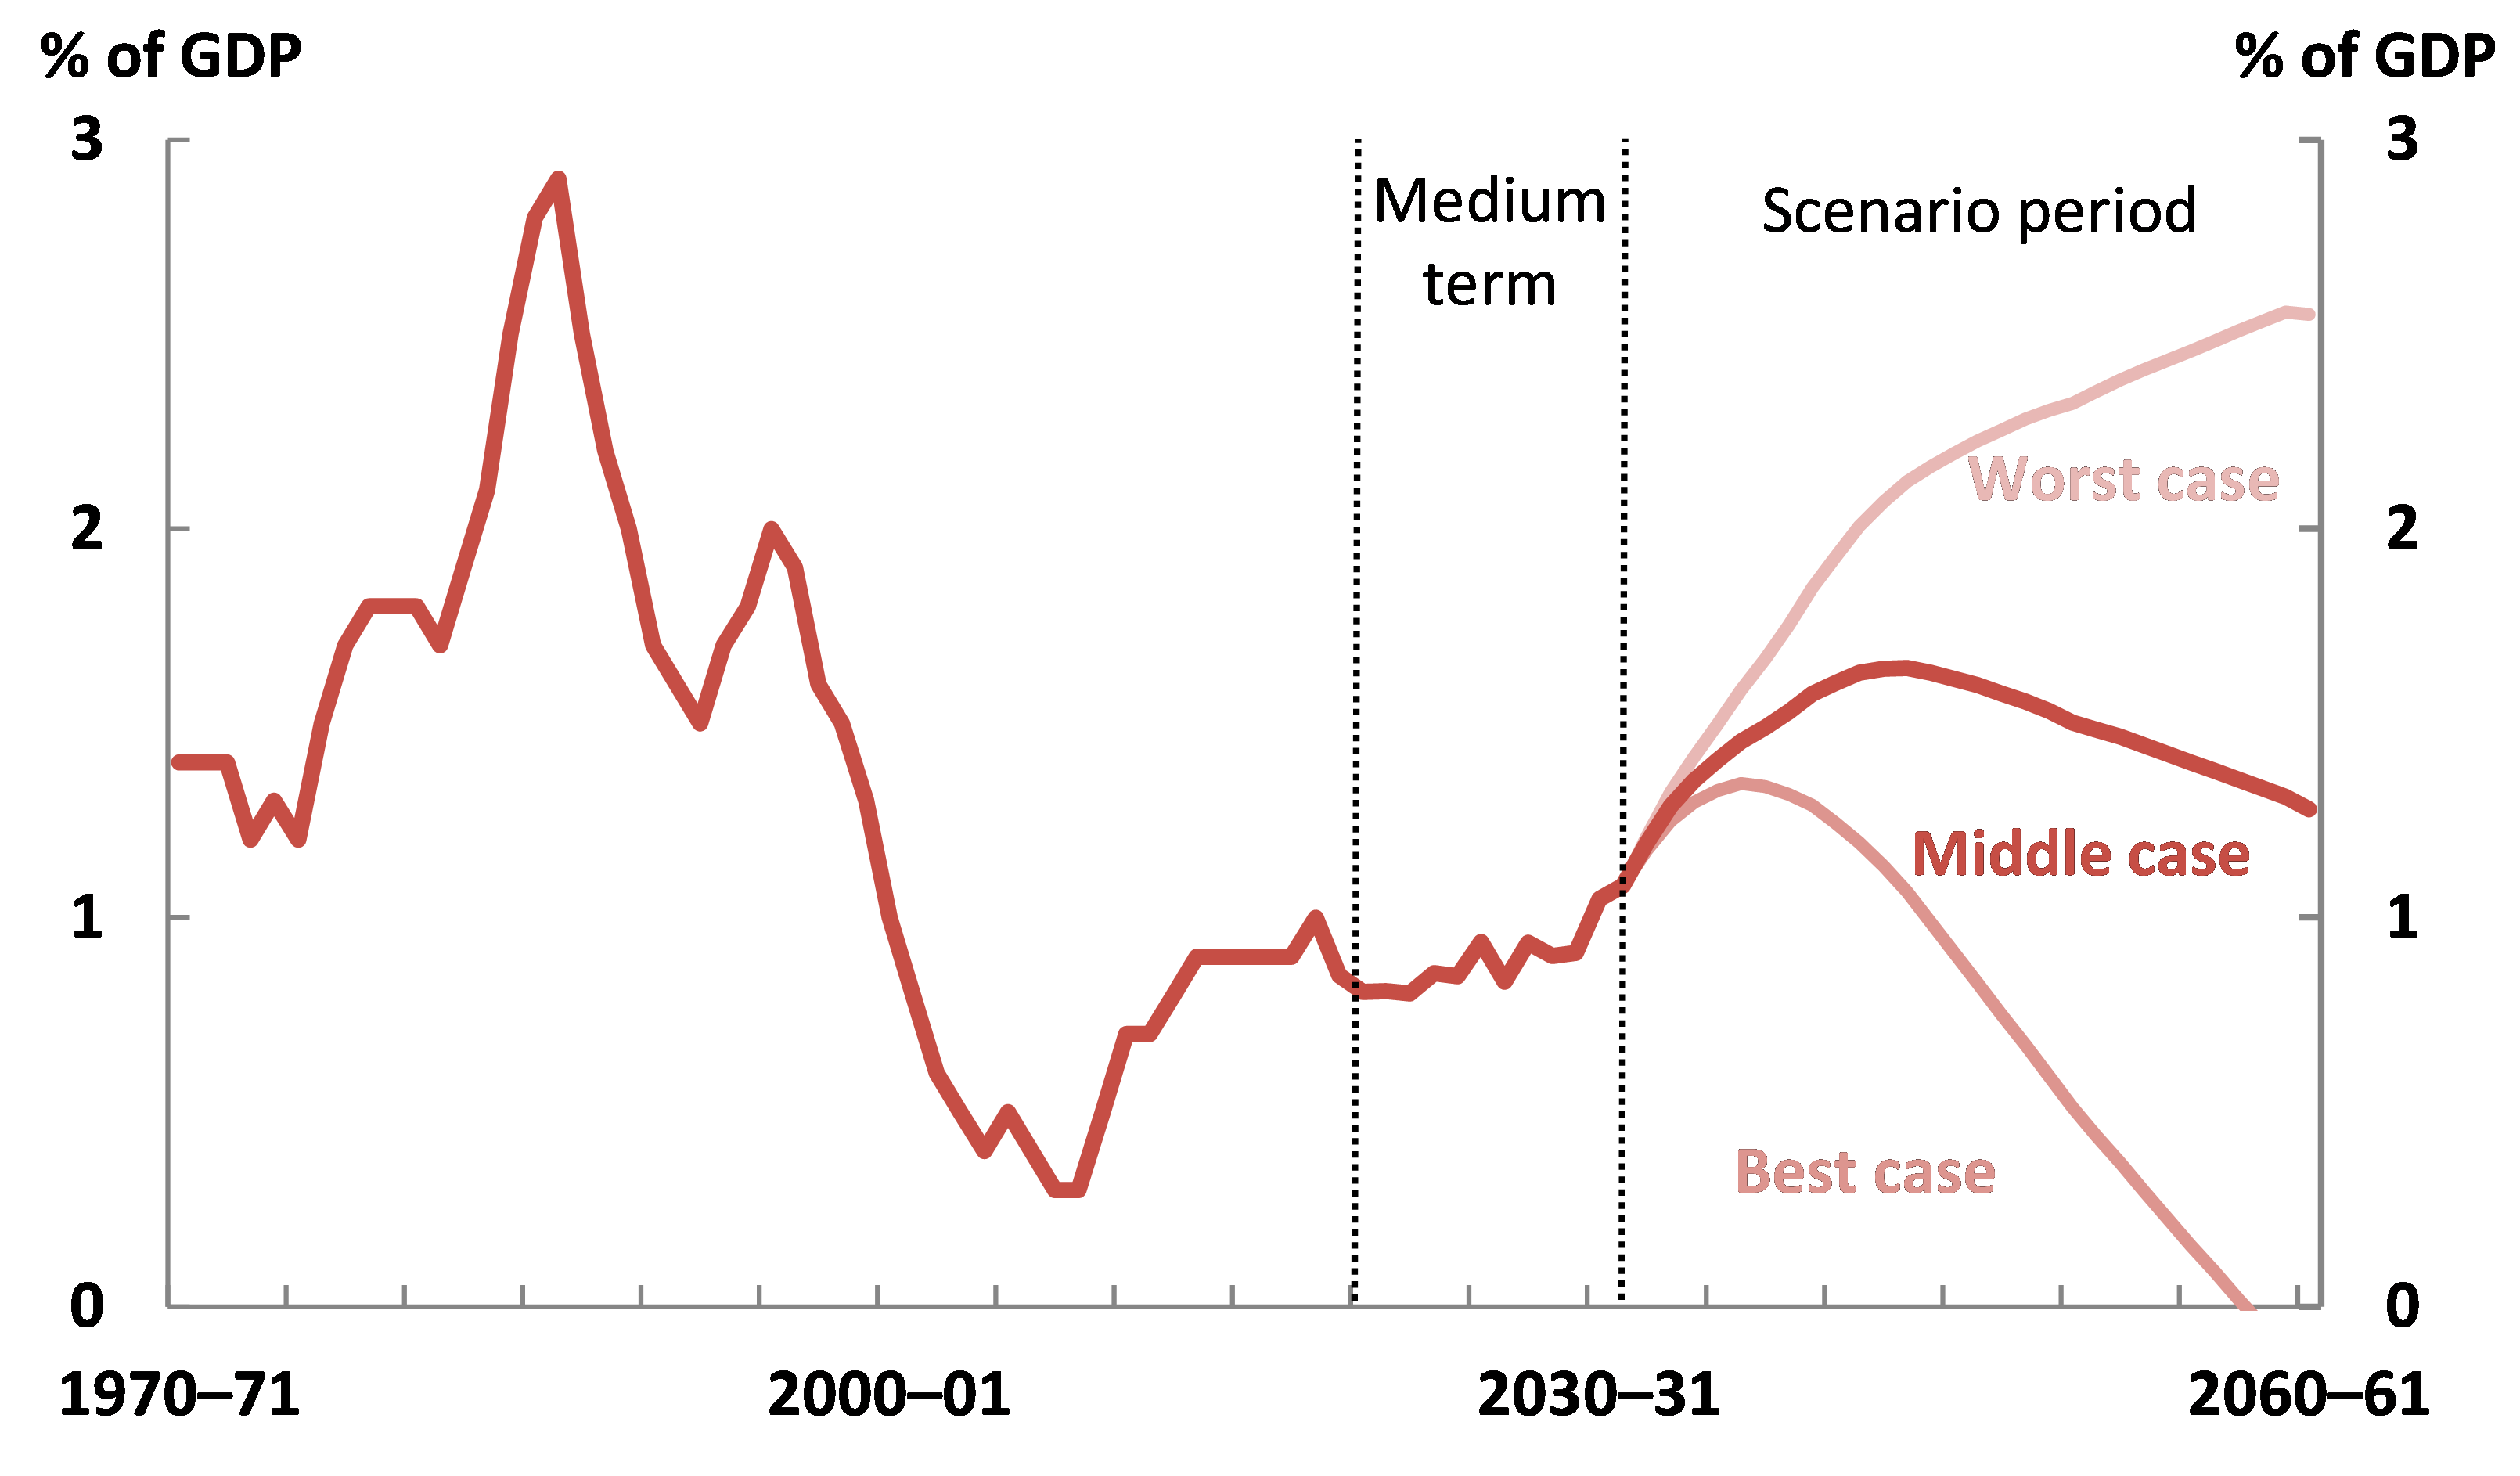
Figure 3-2 demonstrates the impact of debt on interest payments under our middle, best and worst case scenarios. Under the middle case, the rollover of existing debt to higher interest rates results in interest payments continuing to climb even as debt declines. Interest payments peak at 1.6 per cent of GDP in 2043-44 before declining to 1.3 per cent of GDP in 2060-61. Under the best case scenario, interest payments peak in 2036-37 and decline to zero by 2058-59. Under the worst case scenario interest payments climb steadily before they stabilise at the end of the scenario period.
Our analysis shows that Australia’s fiscal position remains sustainable despite the impact of COVID-19, provided governments can achieve a measured pace of fiscal consolidation.
Provided that this is obtained, governments will not need to resort to a fiscal strategy significantly different from the past. A measured pace of fiscal consolidation—even if the government continues to run modest deficits, as in our middle scenario—is consistent with a fiscally sustainable position.
Conversely, if governments act inconsistently, or late, they may eventually need to consolidate more quickly than governments in the past in order to achieve sustainability again.
It is important to be clear about what this assessment does not say. It is not a conclusion that the level of government debt does not matter at all, nor does it mean that the quality and efficiency of public spending, whether for services or investments, is not crucial.
| Figure 3-2: Most scenarios result in interest payments comparable to recent experience |
| Public debt interest, 1970-71 to 2060-61 |
 |
| Source: 2021-22 Budget and PBO analysis |
Rather, analysing a wide range of plausible paths to examine the impacts on debt over the longer term can provide some confidence that future governments acting to consolidate the fiscal position, maintain a growing economy and achieve manageable borrowing costs will not need to resort to a fiscal strategy significantly different from the past.
This framework provides a useful way of exploring fiscal sustainability over the longer term, and how much variations in the key drivers matter for outcomes such as the debt-to-GDP ratio. As with all modelling, there are limitations to the approach. Two, in particular, are the use of historical averages, and the assumption that the key variables in the analysis are independent of one another.
By building our scenarios around historical averages we have implicitly captured the impact of future economic shocks and policy changes, but only to the extent that these are of a similar magnitude to the past.
It would be more difficult for Australia to maintain a fiscally sustainable position if future economic shocks were consistently larger or more frequent than historical shocks, or if long-term structural shifts meant that growth rates were much lower than they have been historically, both lowering average economic growth and prompting larger budget deficits. Sustained shocks are also likely to affect interest rates, for example by reducing Australia’s attractiveness as a location for global investment relative to other locations.
Our scenarios are currently based on paths of interest rates, growth, and the budget that are treated independently. In reality, these variables are interrelated. This interdependence may lead to ‘exacerbating interactions’, widening the range of possible scenarios. It also means that some of our 27 scenarios are more likely than others, because they involve combinations of these variables that are more likely to occur given their interdependence.
One channel for these interdependences is through the level of debt (rather than just the trajectory), which can affect government borrowing costs and economic growth. Over the long-term, there is no agreed threshold at which the level of debt begins to have a significant impact on growth outcomes, however there is evidence that continually climbing debt will impact subsequent growth.18
Similarly, economic growth and interest rates are expected to maintain a close relationship in the long term. If, for example, productivity growth remains at historical lows (resulting in lower GDP growth) we would expect this to be accompanied by lower interest rates.
Considering interdependencies, particularly the effect of fiscal policy on the economy, will be important for policy-makers considering paths for fiscal consolidation, the debt trajectory and other budget settings.
We will continue to refine our approach to assessing fiscal sustainability over time, including by exploring relationships between the key drivers of sustainability.
4 Budget balance: outlook and key policy driver
- The PBO projects underlying cash deficits to persist but decline over the medium term, from 2.5 per cent of GDP in 2025-26 ($63.3 billion) to 1.5 per cent ($51.6 billion) in 2031-32.
- Receipts as a share of GDP are projected to improve to 24.7 per cent by 2031-32, a little lower than their 2018-19 level of 24.9 per cent. This reflects the projected improvement in the economy and the close relationship between tax collections and economic activity.
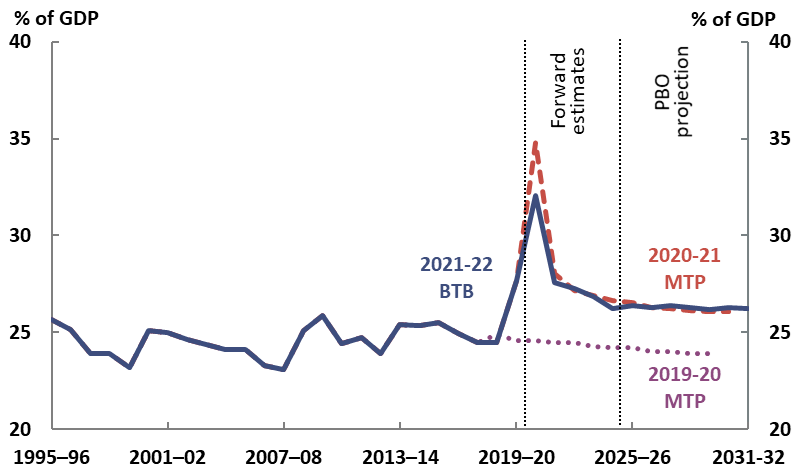
- Payments as a share of GDP are projected be broadly flat at around 26 per cent over the medium term. This is about 2.3 percentage points higher than projected prior to the pandemic, due to both a lower projected level of GDP and higher growth in payments.
- Some specific drivers of these changes include the distribution of personal income tax cuts, capturing the impact of bracket creep, and the NDIS, noting the high level of uncertainty around the future estimates for the scheme.
Budget balances matter because they impact on the starting financial position and the path of fiscal sustainability. Chapter 3 took a longer-term view of the fiscal outlook, assessing the sustainability of the Commonwealth Government’s fiscal position over the next 40 years. The rest of this report takes a closer look at the decade ahead.
This chapter presents the PBO’s projections for the overall budget position and total receipts and payments, and discusses some key drivers and risks to the outlook including net overseas migration, personal income tax, and the NDIS. We continue our exploration of significant uncertainties by presenting a range of possible trajectories for the NDIS.
4.1.1 Projected underlying cash balance
The Commonwealth Government’s fiscal position is projected to improve over the medium term as the Australian and the global economies recover from the COVID-19 pandemic.
As discussed in Box 1 in Chapter 1, the near-term health and economic assumptions underpinning the most recent budget have not all been borne out, with much of Australia’s population re-entering lockdowns from July 2021. Domestic and international experience over the past year indicate that once these restrictions ease, the economy can be expected to recover relatively quickly.19
Figures 4.1 to 4.4 summarise the PBO’s projections for the underlying cash balance, and changes from our previous report. Taken together, these show that:
- while deficits are projected to fall over time, they persist over the decade
- some material changes since late last year are structural, and unrelated to COVID-19 or the associated policy response.
While deficits are projected to fall over time, they can be expected to persist over the decade
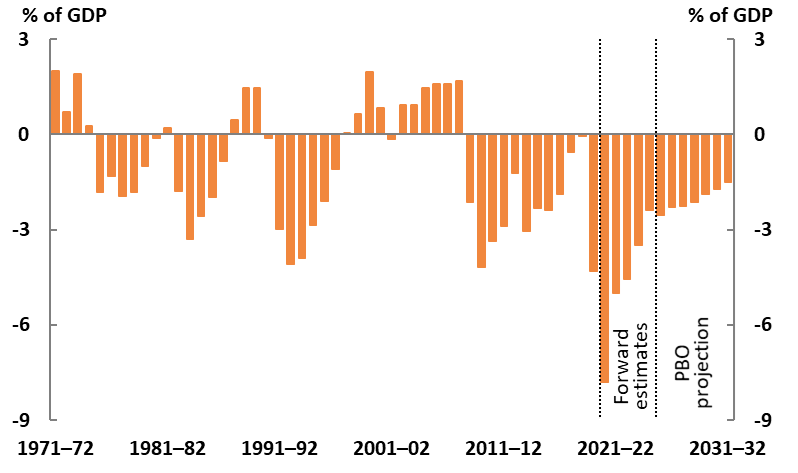
Over the medium term, the PBO projects that the underlying cash balance will improve but remain in deficit, with deficits falling to 1.5 per cent of GDP ($51.6 billion) in 2031-32 (Figure 4-1).
| Figure 4-1: Underlying cash balance |
| 1971-72 to 2031-32 |
 |
| Source: 2021-22 Budget and PBO analysis |
Improvements in the budget balance during the forward estimates period and the medium term reflect both the winding down of payments relating to the COVID-19 pandemic and receipts improving as the economy recovers (Figure 4-2). Surpluses occur when total receipts are greater than total payments, and deficits occur when total payments are greater than total receipts.
| Figure 4-2: Total receipts and payments |
| 1971-72 to 2031-32 |
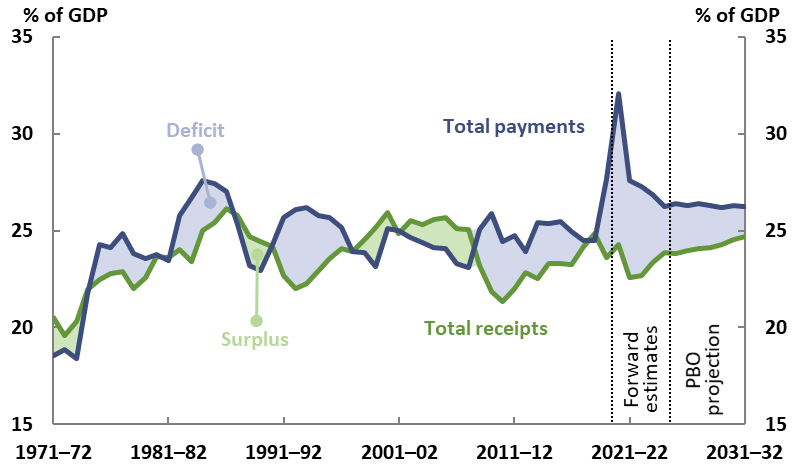 |
| Note: The shaded areas broadly correspond to a surplus (green) or deficit (blue) by today’s definition of the underlying cash balance. |
| Source: 2021-22 Budget and PBO analysis. |
Some material changes since late 2020 are structural, and unrelated to COVID-19 or the associated policy response.
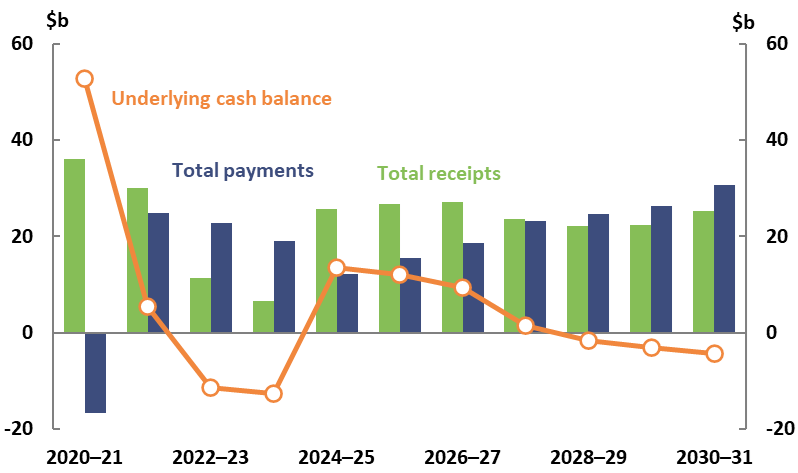
Figure 4-3 shows how projections for total receipts, total payments and the underlying cash balance have changed since the projections we made late last year.
Revisions over the forward estimates period reflect both the economic recovery and policy factors. Compared to last year’s projections, the government’s revisions to the 2020-21 underlying cash balance have reduced the deficit by $52.7 billion in this year’s budget, mainly reflecting a stronger-than-anticipated economic recovery which has driven an upwards revision in forecast taxation receipts. Budget revisions mean that the estimated size of the underlying cash deficit increased in 2022-23 and 2023-24, due to an increase in payments, including the NDIS and aged care.
Looking at the medium-term projections period from 2025-26, the size of revisions to the PBO’s underlying cash balance projection fall over time, so that cash deficits are broadly similar to our last report by the end of the decade. Throughout the first half of the medium term, upwards revisions in receipts more than offset upwards revisions in payments, while the reverse is projected by the end of the period.
| Figure 4-3: Revisions to projections compared to the 2020-21 report |
| 2020-21 to 2030-31 |
 |
| Source: 2020-21 and 2021-22 Budget and PBO analysis |
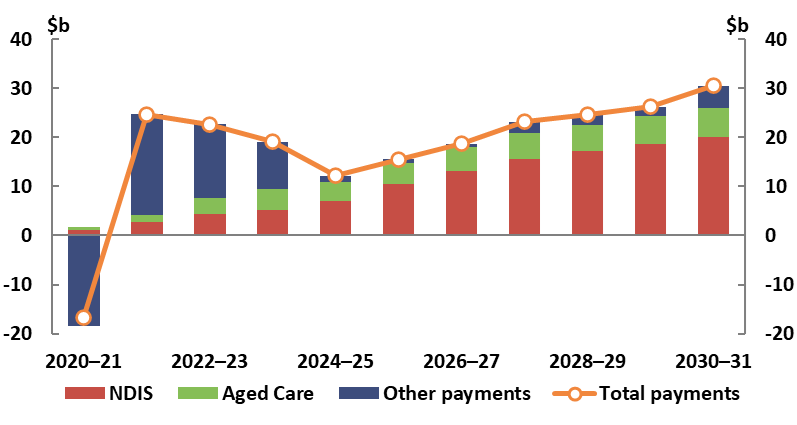
Figure 4-4 breaks down the revisions to payments since late 2020, showing that the largest contributors are NDIS and aged care. Both of these are unrelated to the COVID-19 pandemic and the government’s policy response: aged care revisions reflect new policy measures and NDIS revisions reflect increases to expected participant numbers and average costs.
As discussed in section 4.3.3, there is substantial uncertainty around NDIS estimates, as this sizeable and relatively new scheme has only just completed its full geographical roll-out. As a result, the size of these revisions could be significantly different from those set out below. To illustrate the impacts of different assumptions on estimates for the NDIS, the PBO has developed two scenarios to explore a range of possible outcomes. Figure 4-4 shows revisions under our base scenario.
| Figure 4-4: Breakdown of revisions in total payments compared to the 2020-21 report |
| 2020-21 to 2030-31 |
 |
| Note: NDIS estimates reflect the PBO’s base NDIS scenario. |
| Source: 2020-21 and 2021-22 Budget and PBO analysis. |
4.1.2 Fiscal balance
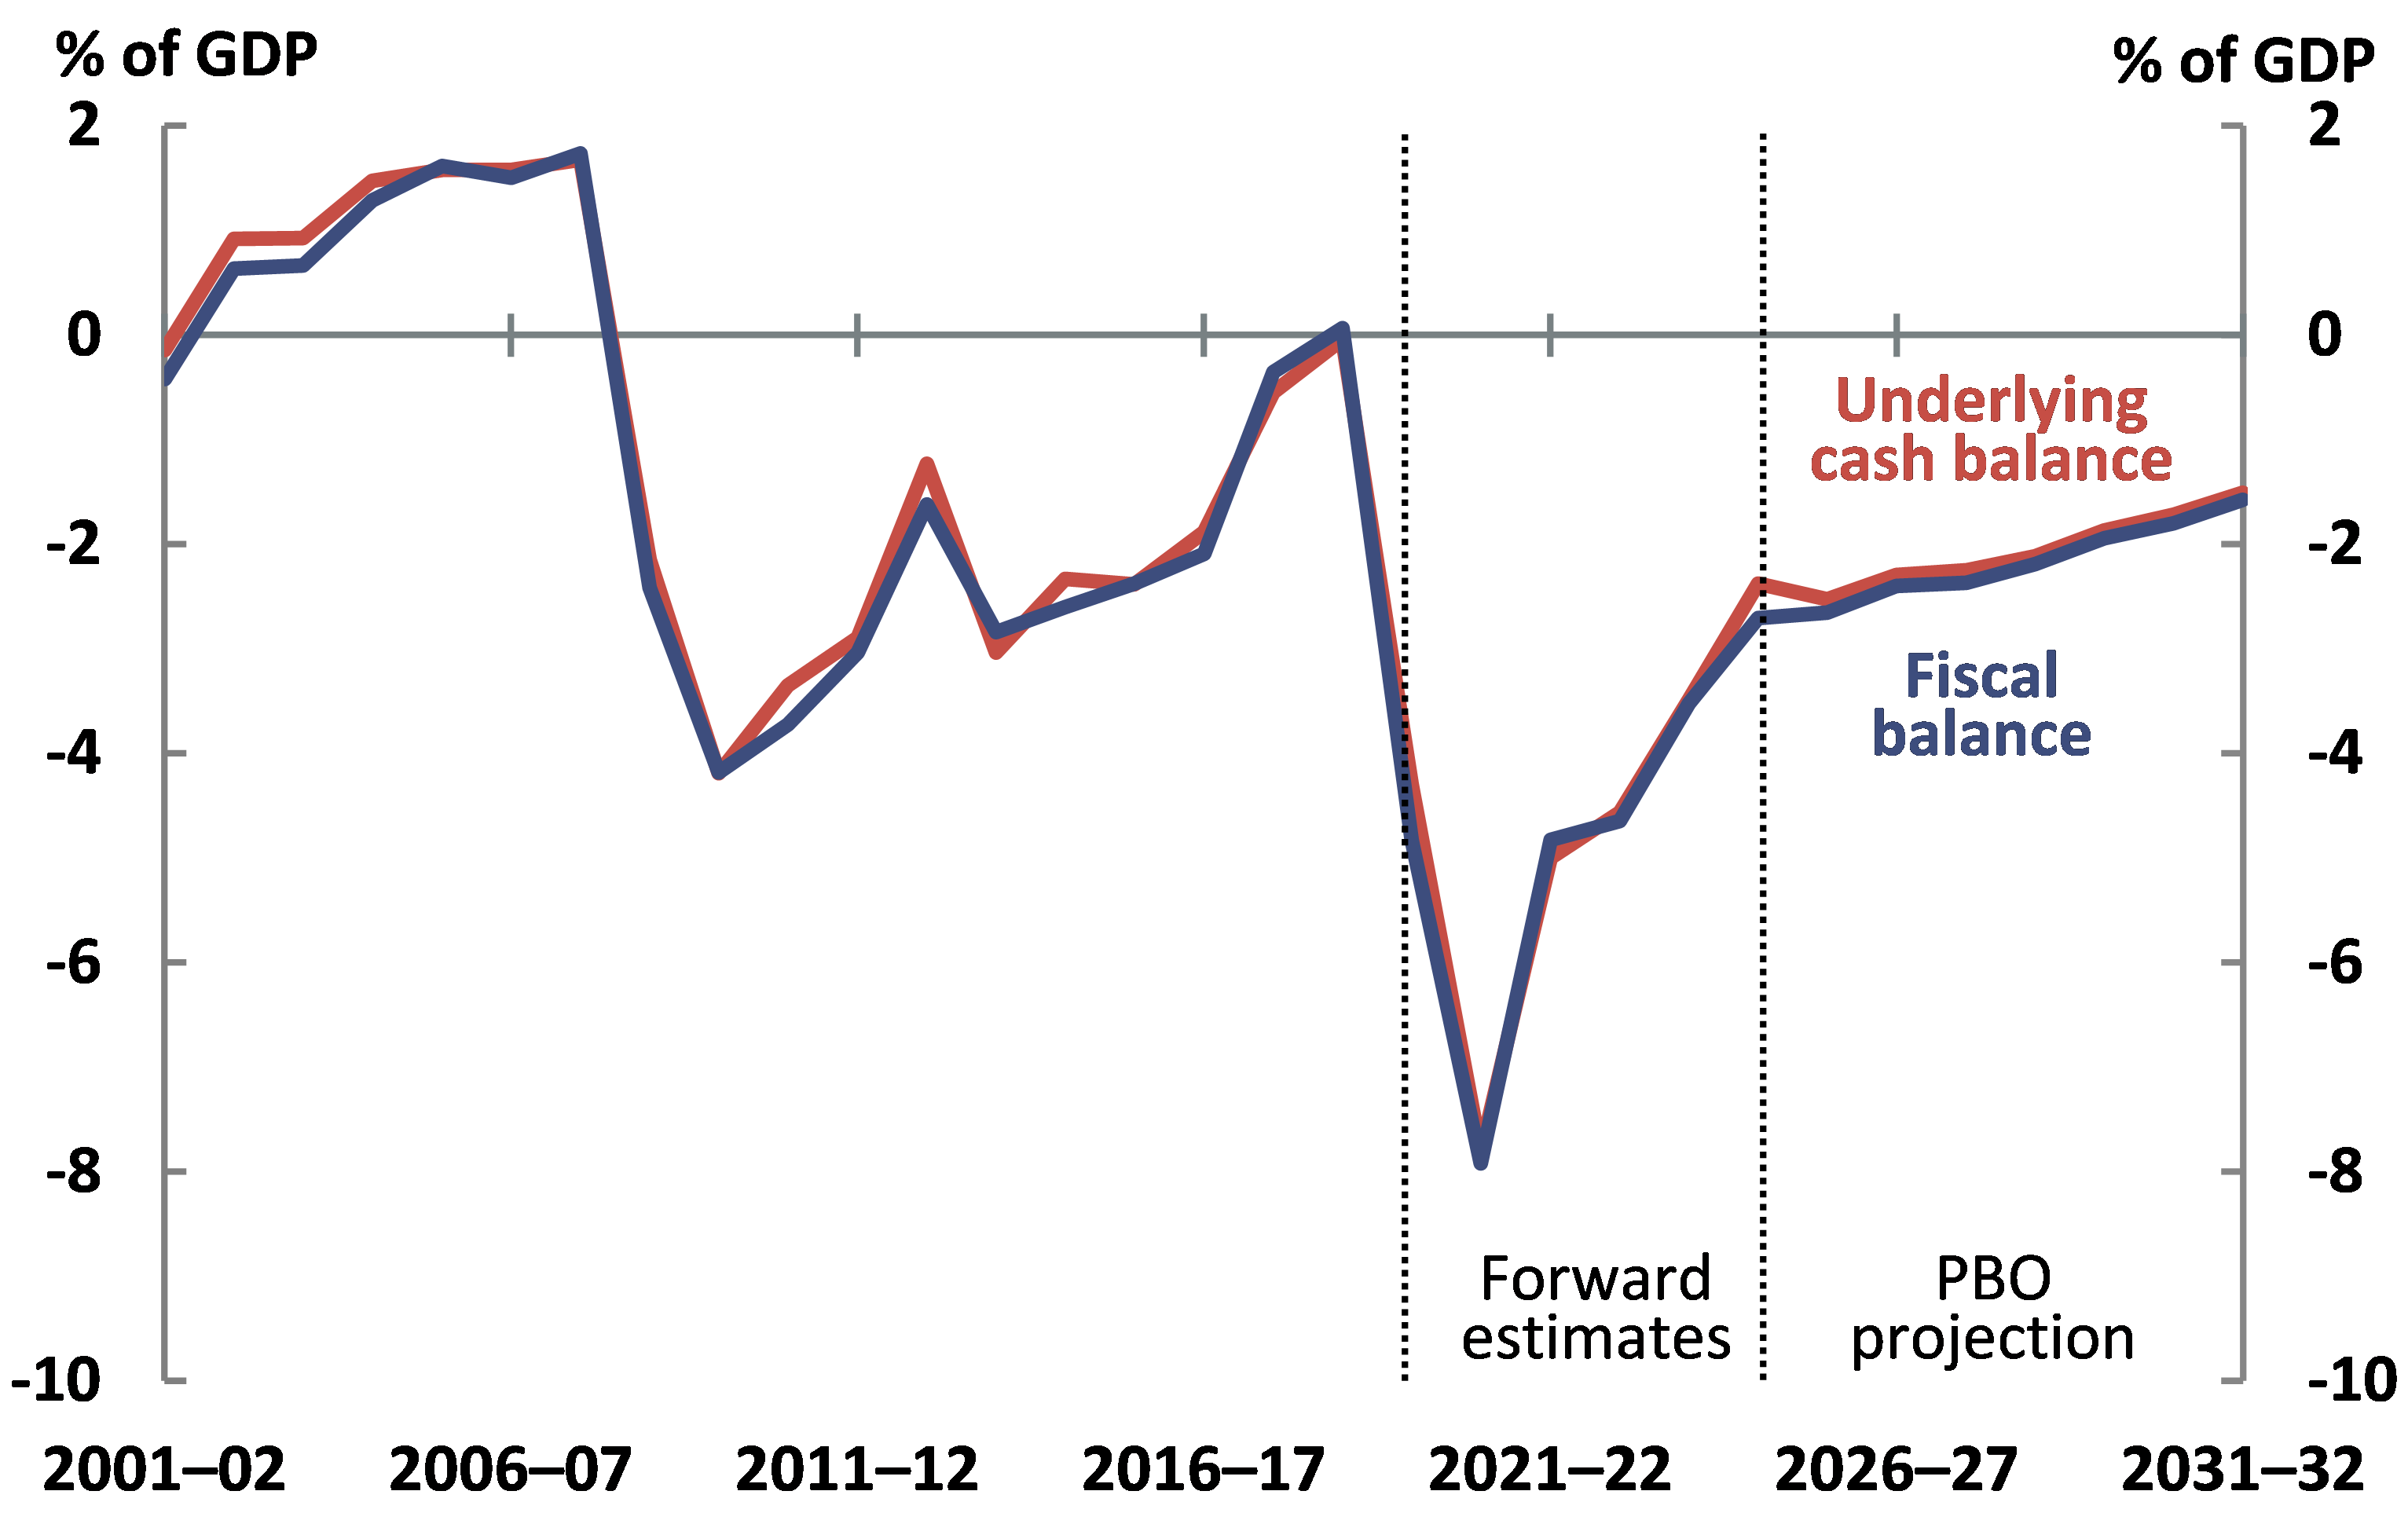
Projections for the fiscal balance, an accrual measure of the budget position, are similar to those for the underlying cash balance (Figure 4-5).20 Beyond the forward estimates period, the PBO projects the fiscal deficit to gradually fall as a share of GDP from 2.7 per cent in 2025-26 to 1.6 per cent in 2031-32.
| Figure 4-5: Fiscal balance |
| 2001-02 to 2031-32 |
 |
| Source: 2021-22 Budget and PBO analysis. |
The drivers of the improving fiscal balance are similar to those of the underlying cash balance. The fall in the fiscal deficit reflects both the winding down of expenses incurred in response to the COVID-19 pandemic, and revenue improving as the economy recovers.
4.2.1 Projected total receipts
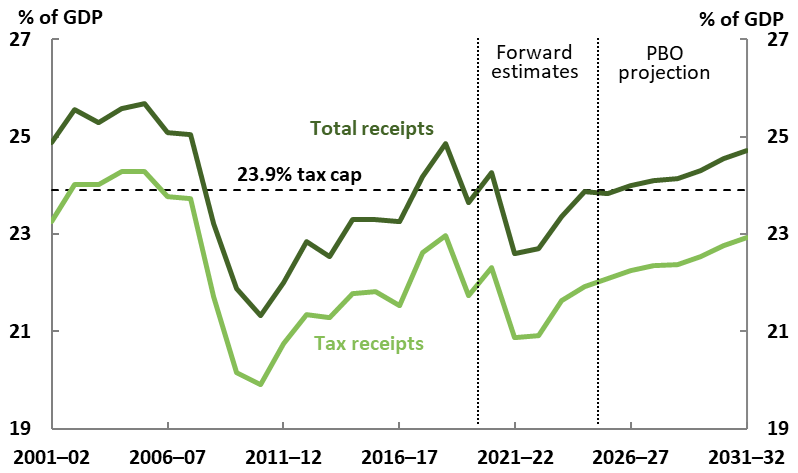
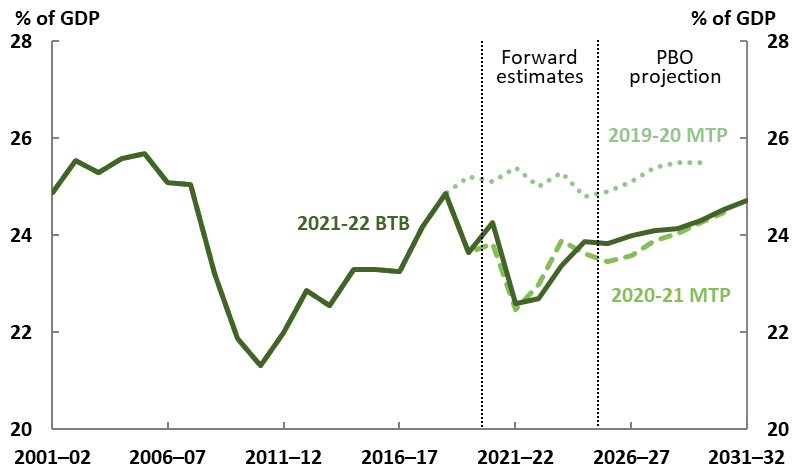
The Commonwealth Government projects that total receipts as a share of GDP will fall in 2021-22, before increasing over the remainder of the forward estimates period, reflecting the COVID-19 pandemic and associated policy response, and the implementation of the Personal Income Tax Plan. By the end of the medium-term projections period in 2031-32, the PBO projects total receipts to have risen to 24.7 per cent of GDP ($847 billion) as the economy recovers (Figure 4-6). This is slightly (0.2 percentage points) lower than the pre-pandemic level in 2018-19.
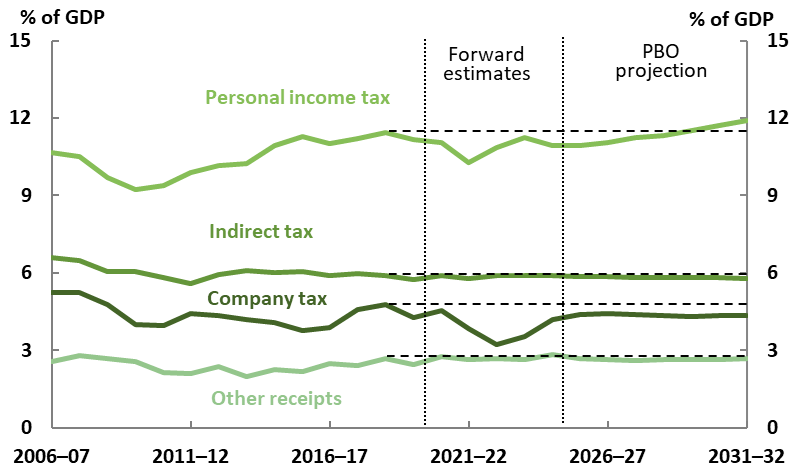
- The main driver of the increase in total receipts over the medium term is a projected rise in personal income tax (Individuals and other withholding taxes), due to ‘bracket creep’.
- Bracket creep occurs in a progressive personal income tax system when income growth causes taxpayers to pay an increasing proportion of their income in tax each year. The PBO expects to release an explainer piece on bracket creep later this year. Trends in personal income tax and its future distribution by income and gender are discussed further in the key trends and drivers section of this chapter (see section 4.3.2)
- Company tax, indirect taxes (mainly the Goods and Services Tax (GST)) and other taxes and receipts are projected to remain relatively stable as a share of GDP over the medium term (Figure 4-7).
| Figure 4-6: Total receipts and tax receipts |
| 2001-02 to 2031-32 |
 |
| Notes: Total receipts includes tax and non-tax receipts. Non-tax receipts include interest and dividend earnings (including Future Fund earnings), NDIS contributions from the states and territories, royalties and the sale of non-financial assets. |
| Source: 2021-22 Budget and PBO analysis. |
| Figure 4-7: Breakdown of receipts |
| 2006-07 to 2031-32 |
 |
| Note: Broadly speaking, an indirect tax is a tax levied on goods and services. Indirect taxes comprise GST, fuel, tobacco and alcohol excise and customs duty, agricultural levies, passenger movement charge, broadcasting license fees and a range of other levies, penalties and charges. All other receipts are grouped together as ‘other receipts’. The dashed horizontal lines show the 2018-19 levels for comparison. |
| Source: 2021-22 Budget and PBO analysis. |
As part of the government’s medium-term fiscal strategy, the government has a commitment to maintaining the ratio of tax receipts to GDP at or below 23.9 per cent of GDP. The PBO projects total tax receipts to remain below this cap, reaching 22.9 per cent of GDP by 2031-32, so the tax cap is not expected to be a constraint over the medium term. 21
Receipts have been revised upwards in each year of the medium term, by around $22 billion to $28 billion per year. This is driven by revisions in Personal income tax, Company tax, and GST due to a stronger-than-expected economic recovery. Despite this recovery, the impact of COVID-19 on the fiscal position remains notable over the medium term. Total receipts as a share of GDP are still projected to be lower in each year compared to our pre-pandemic projection (Figure 4-8).
| Figure 4-8: Comparison of total receipts |
| 2001-02 to 2031-32 |
 |
| Source: 2019-20, 2020-21 and 2021-22 Budget and PBO analysis. |
| Figure 4-9: Total payments |
| 1995-96 to 2031-32 |
 |
| Source: 2019-20, 2020-21 and 2021-22 Budget and PBO analysis. |
Compared with the PBO’s pre-pandemic payment projections, payments as a share of GDP are projected to be substantially higher in each year over the medium term, due to both a lower projected level of GDP and higher projected payments.
In line with the substantial increase in payments in 2019-20 and 2020-21, growth in real government payments per person (a measure which is adjusted for inflation and population growth) was also far above average in these years and is expected to moderate (Figure 4-10).
Beyond the forward estimates period, the PBO projects that real per person payments will increase by 1.4 per cent per year under current policy settings. While this is 0.3 percentage points lower than the long run average of 1.7 per cent annual growth prior to the COVID-19 pandemic, the PBO projection includes only announced policies. This means that actual payments could be higher (or lower) as governments make additional decisions.
The rest of this chapter takes a closer look at some of the risks to, and material drivers of, the PBO’s receipts, payments, and underlying cash balance projections.
| Figure 4-10: Average annual growth in real payments per person |
| 1991-92 to 2031-32 |
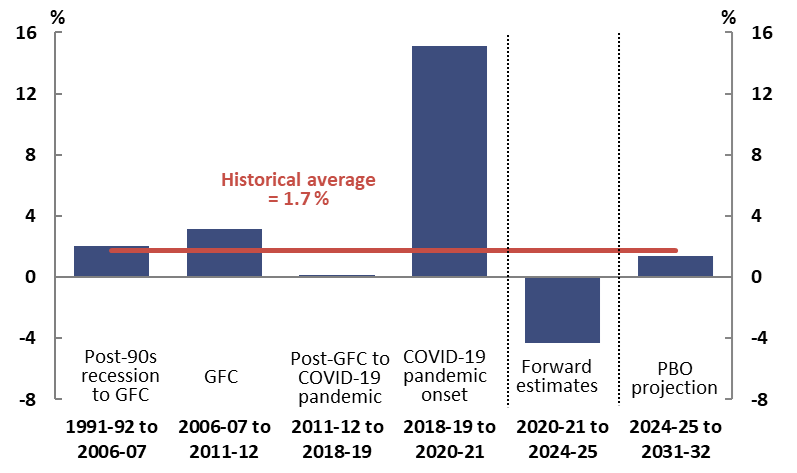 |
| Note: Long run average calculated over 1991-92 to 2018-19. The average including the onset of COVID-19 and associated policy response in 2019-20 and 2020-21 would increase to 2.6 per cent. GFC refers to the global financial crisis. |
| Source: 2021-22 Budget and PBO analysis. |
4.3.1 Risks around projected receipts and payments
Given the ongoing COVID-19 pandemic, there is heightened uncertainty around the receipts and payments projections in this report. The strong link between receipts and the economy means there are risks to both the upside and downside on receipts, with the risks skewed towards lower receipts in the near term. The risks to payments are tilted towards higher payments, arising fromthe potential for increases for both health and non-health-related reasons. Broadly speaking, the main risks to receipts and payments arise from three sources:
- impacts of the ongoing COVID-19 pandemic and the associated Commonwealth response
- the economic outlook in addition to direct COVID-19 impacts
- other structural trends, including expectations around the quality and volume of services provided by government.
The pandemic is ongoing, with continued risks to health, the economy and budgets
The outcomes for both receipts and payments are inextricably linked to the trajectory of the COVID-19 pandemic. Receipts are strongly related to the size and composition of the economy, so that a longer period of widespread economic restrictions would reduce receipts relative to these projections, while a faster or stronger recovery from the economic downturn would increase them.
One key risk to the economic outlook is the timing around the re-opening of Australia’s borders and the consequent impacts on the recovery of net overseas migration. As a key determinant of the size of Australia’s population, the level of net overseas migration affects the size of the economy, but also has a number of important impacts on the economy and budget position. Box 4 describes some of these impacts further.
While total payments tend to be less responsive to the economy than receipts, extended economic restrictions would mean higher projected payments through three channels: those directly related to the health response, those through existing structural or temporary support measures such as unemployment benefits and the COVID-19 Disaster Payment, and potentially through additional support mechanisms as the pandemic evolves. A related risk to the Commonwealth Government’s budget is the impact of COVID-19 on state and territory economies and budgets, if this resulted in calls for the Commonwealth Government to provide greater transfer payments to the states and territories.
Many of these risks are related to more immediate impacts of the current strains of COVID-19; the emergence of additional strains of the virus is one of several possible significant events affecting the economic and fiscal outlook. 22 The longer-term impacts of COVID-19 are yet to be fully understood, with the potential for ongoing but highly uncertain health, economic and fiscal impacts.
Other aspects of the economic outlook present upside and downside risks to the budget
While the direct impacts of COVID-19 present the most obvious risks to the economy and fiscal position, the potential for other material impacts remains.
Commodity prices have a strong influence on Australia’s terms of trade and therefore nominal GDP and tax receipts. Commodity prices can be volatile and the budget takes a deliberately prudent approach to forecasts. This means, for example, that the recent sharp increase and fall in iron ore prices will not detract from forecast company tax receipts, because the budget assumed a decline in the price to US$55 per tonne free on board. To illustrate the sensitivity of the budget position, if the iron ore price had fallen immediately to US$55 per tonne in May 2021 rather than declining to that level by the end of March 2022 as assumed in the Budget, the government estimates that tax receipts would be $8.3 billion lower in 2021-22 and around $3.5 billion lower in 2022-23 than originally estimated. 23 To put this in perspective, the reduction in 2021-22 receipts is broadly comparable to the Commonwealth’s annual payments for the Child Care Subsidy.
Another important uncertainty is how wages and prices would respond to less spare capacity in the economy if the recovery proceeds as expected. As the Reserve Bank notes in its recent Statement on Monetary Policy, under their baseline scenario, the unemployment rate would decline to around 4 per cent by the end of 2023, which would be expected to cause steady increases in wages and inflation. But Australia has only experienced this rate of unemployment once since the mid-1970s (briefly in 2007-08), so predicting the response of the economy—and therefore of fiscal aggregates such as receipts which are sensitive to the economy—is more difficult than usual. 24
Looking over the medium and longer term, the rate of labour productivity growth remains another major source of uncertainty. Australia’s average productivity growth has slowed since around 2005. It has averaged around 1.2 per cent per year over the last complete productivity cycle, lower than the 30-year average of 1.5 per cent assumed in the central projections in the Intergenerational Report. 25 As the Organisation for Economic Co-operation and Development (OECD) note in their 2021 Economic Survey for Australia, raising productivity growth is needed for a sustainable recovery and boosting living standards. 26 From a fiscal perspective, the implication is that productivity is also the key driver of personal income tax receipts over the longer term.
Australians’ expectations about the volume and quality of services provided by government mean greater risks that payments will be higher
Some trends and sources of risk that will affect Australia and the Commonwealth budget over the decades ahead are known, such as climate change, while other factors not considered will doubtless also become important over the decade ahead.
One particular area where policy is expected to evolve over the decade is aged care. As noted in the Intergenerational Report, the response to the findings and recommendations into the Royal Commission into Aged Care Quality and Safety will continue to significantly increase spending on aged care in the medium and long term.27 For example, in its response to the Commission the Government accepted in-principle the Commission’s recommendation that the aged care planning regime should ‘provide demand-driven access to aged care based on assessed need’ and it is currently developing a new home care policy. The shift from the current approach of a set number of home care packages to a demand-driven system would be expected to increase spending as the amount of subsidised assistance grows to match demand.
The next two sections look further at drivers of the budget projections, investigating two programs representing large and growing shares of the economy: personal income tax and the NDIS.
|
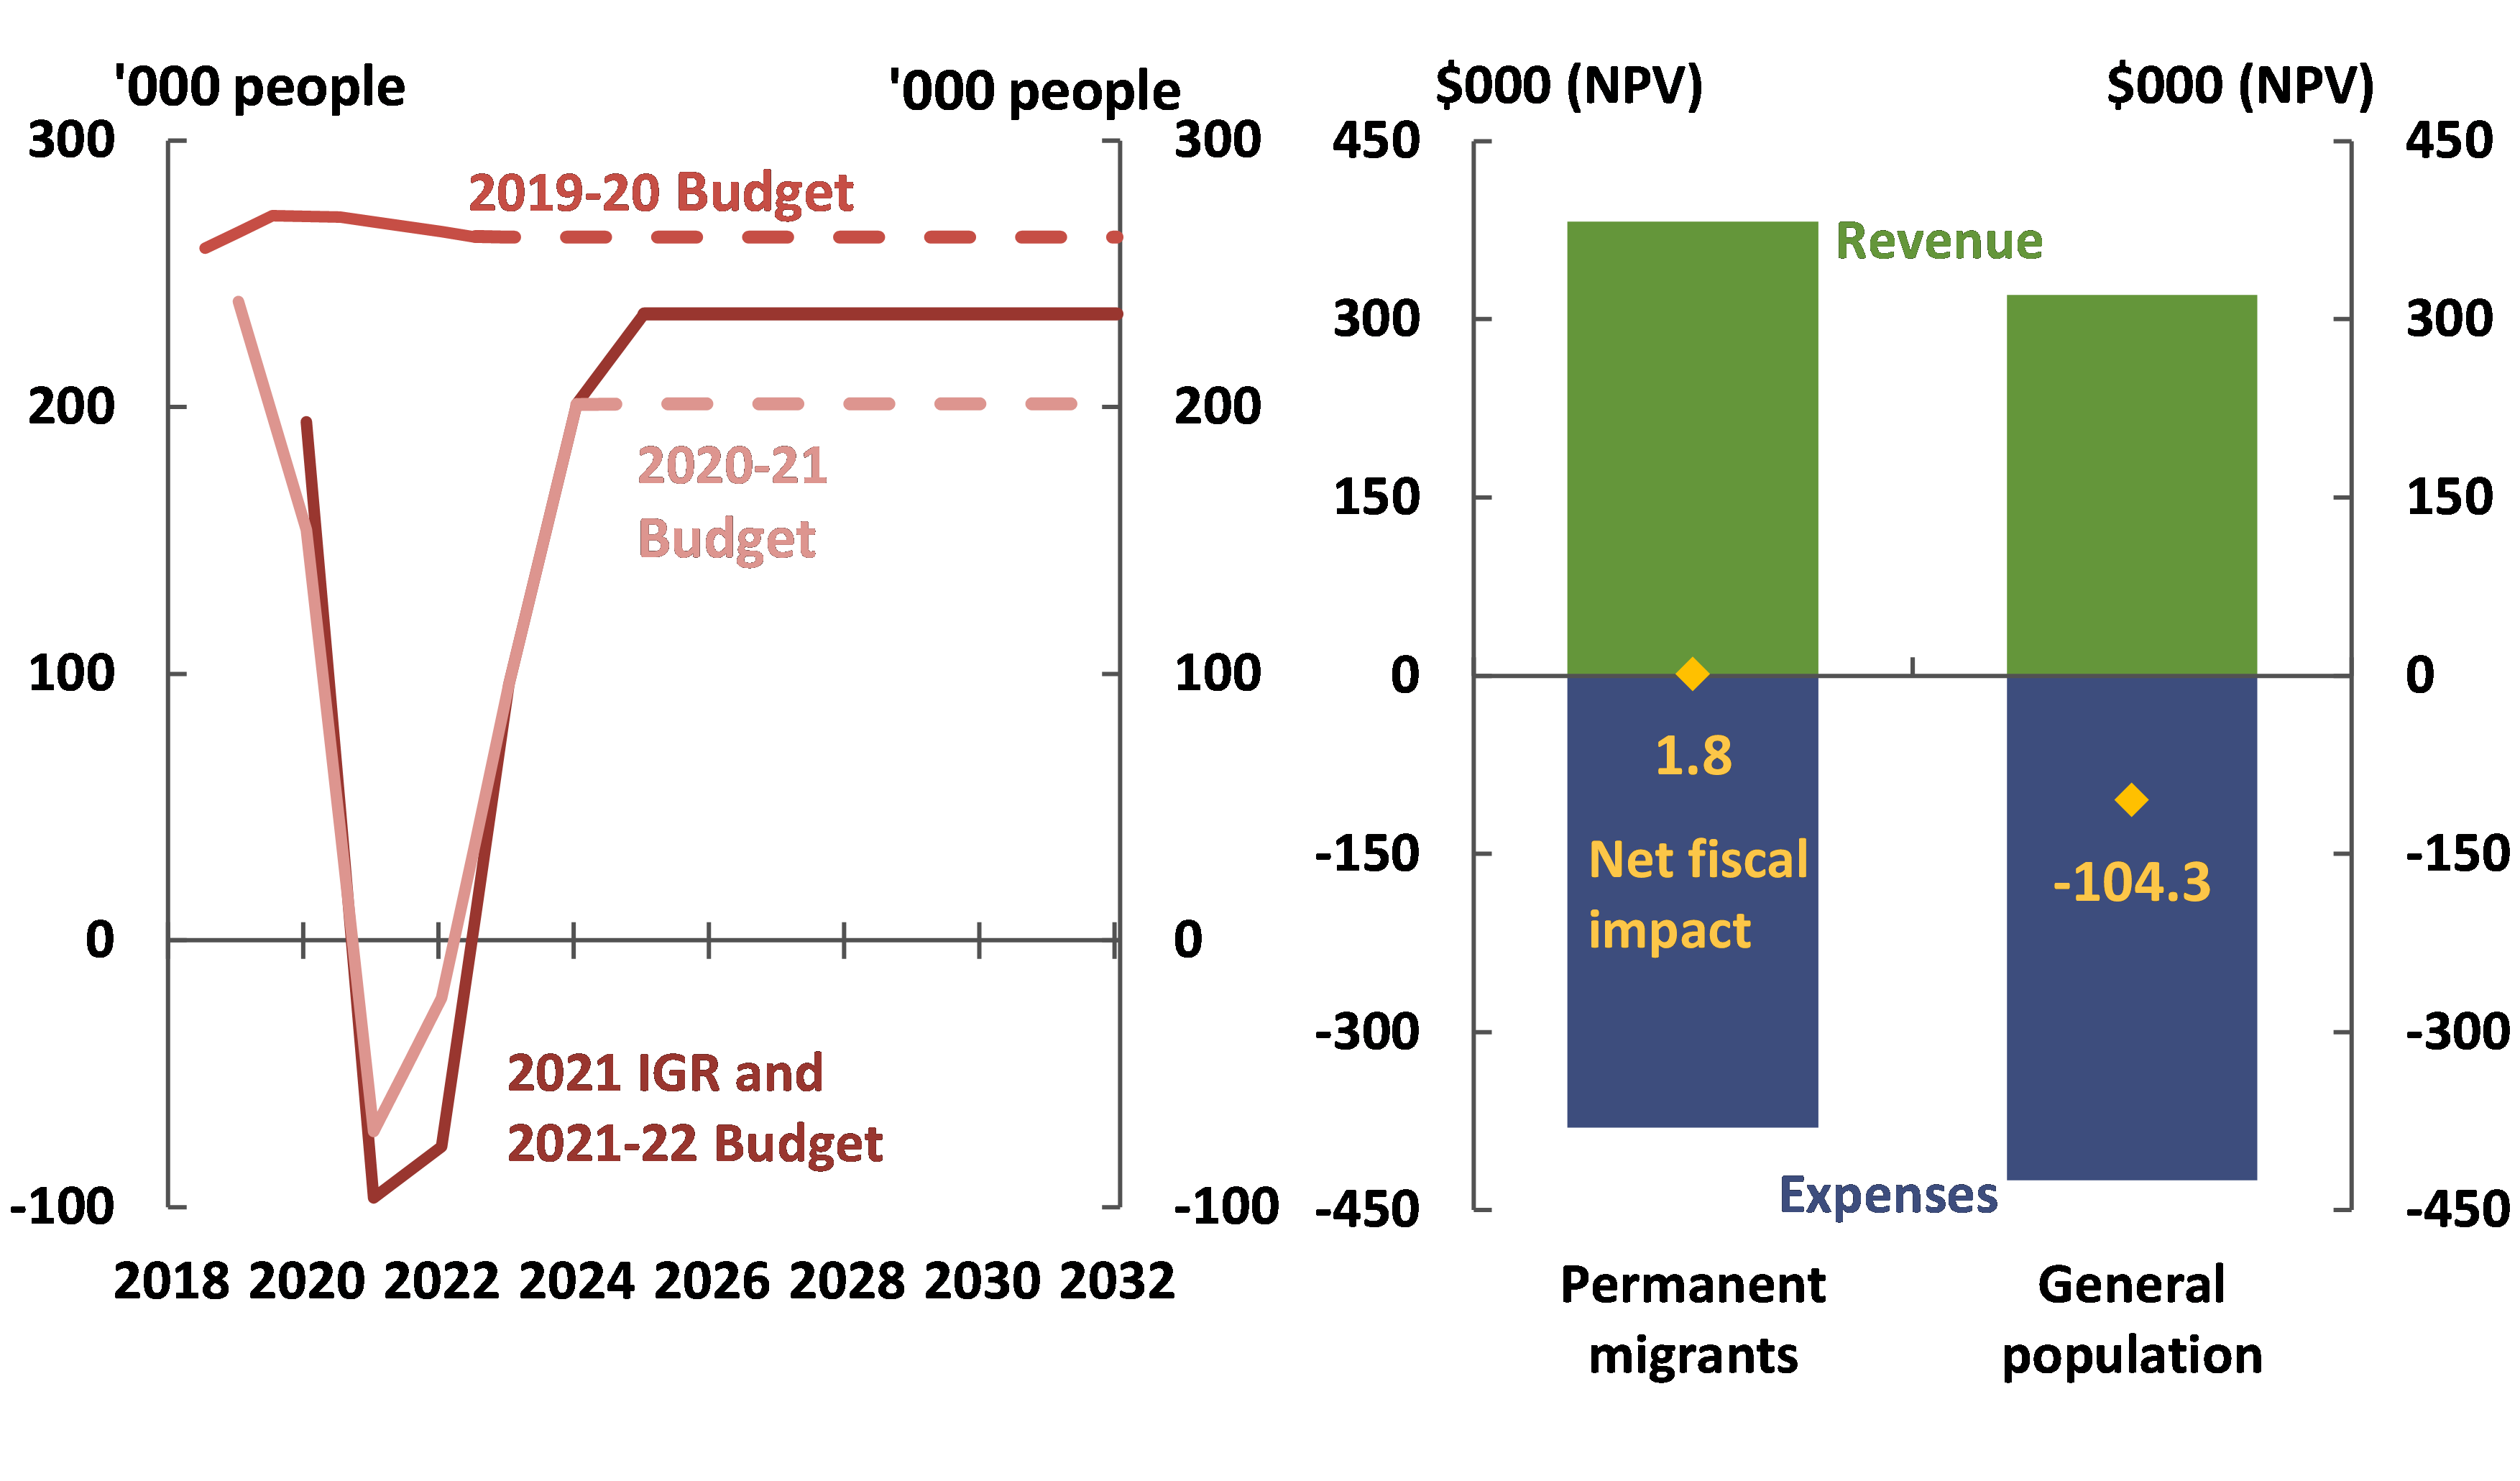
Box 4: The lasting impact of decreased migration on the budget balance The closure of Australia’s international borders due to COVID-19 has caused a significant reduction in net overseas migration, with more people estimated to have left Australia than arrived in 2020-21 (Figure 4-11).28 While annual net overseas migration is assumed to recover towards historical levels once borders re-open, the temporary fall will result in a permanently lower population level, and this has economic and fiscal consequences. Australia’s migration program increases both the size of the economy and the economic output per person, because migrants tend to be younger and more skilled than the general population.29 Because of the composition of Australia’s migration program, the impact of this reduced migration is expected to be worse for the budget balance than an equivalent reduction to the population from other causes, such as a reduced fertility rate. On average, over the course of their whole life, Australians receive more transfers from the Commonwealth than they pay in taxes, so their lifetime impact on the budget balance is negative. For permanent migrants it is almost neutral (Figure 4-12).30 When interpreting these numbers, it is important to consider that the overall fiscal impacts of migration are one element of the impact of the migration program on the wellbeing of Australians. The impacts of this reduction in migration have been incorporated in the Budget and Intergenerational Report. A longer-than-expected period of international border closures would, however, result in an extended period of lower net overseas migration and, therefore, still lower ongoing population, total economic growth and lower (that is, worse) budget balances. There would also be some near-term effects of an extended pause in migration, some of which could be partially offsetting. The Reserve Bank of Australia has noted that an extended period of border closures could cause wages growth to pick up more quickly than currently expected; while this would tend to increase tax revenues, associated constrained production and investment could negatively affect them.31 The latest Intergenerational Report helps put the size of this ongoing fiscal impact into context: under a sensitivity that ‘effectively [replaces] net overseas migration losses during the … pandemic over the long term’, the population would be around 4 per cent higher by the early 2060s, and the projected underlying cash balance would improve by 0.5 percentage points of GDP.32
(a) The 2019-20 and 2020-21 Budgets do not include medium-term projections for net overseas migration, so the dotted lines represent what these projections would be if net overseas migration were constant from the end of the forward estimates over the long term. (b) PBO adaptation of Chart 2-10 in the 2021 Intergenerational Report. Fiscal balance impact in net present values (NPV) in 2018-19 dollars. The fiscal impact of different categories of visas are weighted based on a 6-year average of the number of migrants of each type over 2012-13 to 2018-19 and weighted impacts aggregated to estimate the average impact of all permanent migrants. Because the estimated impact is close to zero, the sign of the estimate is highly sensitive to the time period used for this analysis. Analysis includes only the impact on Commonwealth Government expenses and revenue that are easily attributable to individuals. Revenue such as corporate tax, and expenses such as defence, as well as fiscal impacts at the state and local government level are not included. The resulting analysis may therefore somewhat overstate the positive national fiscal impact of migrants to the extent that state and local governments incur more of the expenses related to migration, such as infrastructure. Estimates are sensitive to assumptions such as the discount rate used to calculate net present values, so are best interpreted as relativities rather than in absolute terms. Source: 2019-20, 2020-21 and 2021-22 Budgets, 2021 Intergenerational Report, Australian Bureau of Statistics (ABS) Migration, Australia, 2019-20 (previously cat. no. 3412.0) and PBO analysis. |
4.3.2 Trends in personal income tax
Personal income tax receipts are the biggest component of the Commonwealth’s taxation system, and the trends and drivers which affect them are material for total receipts.
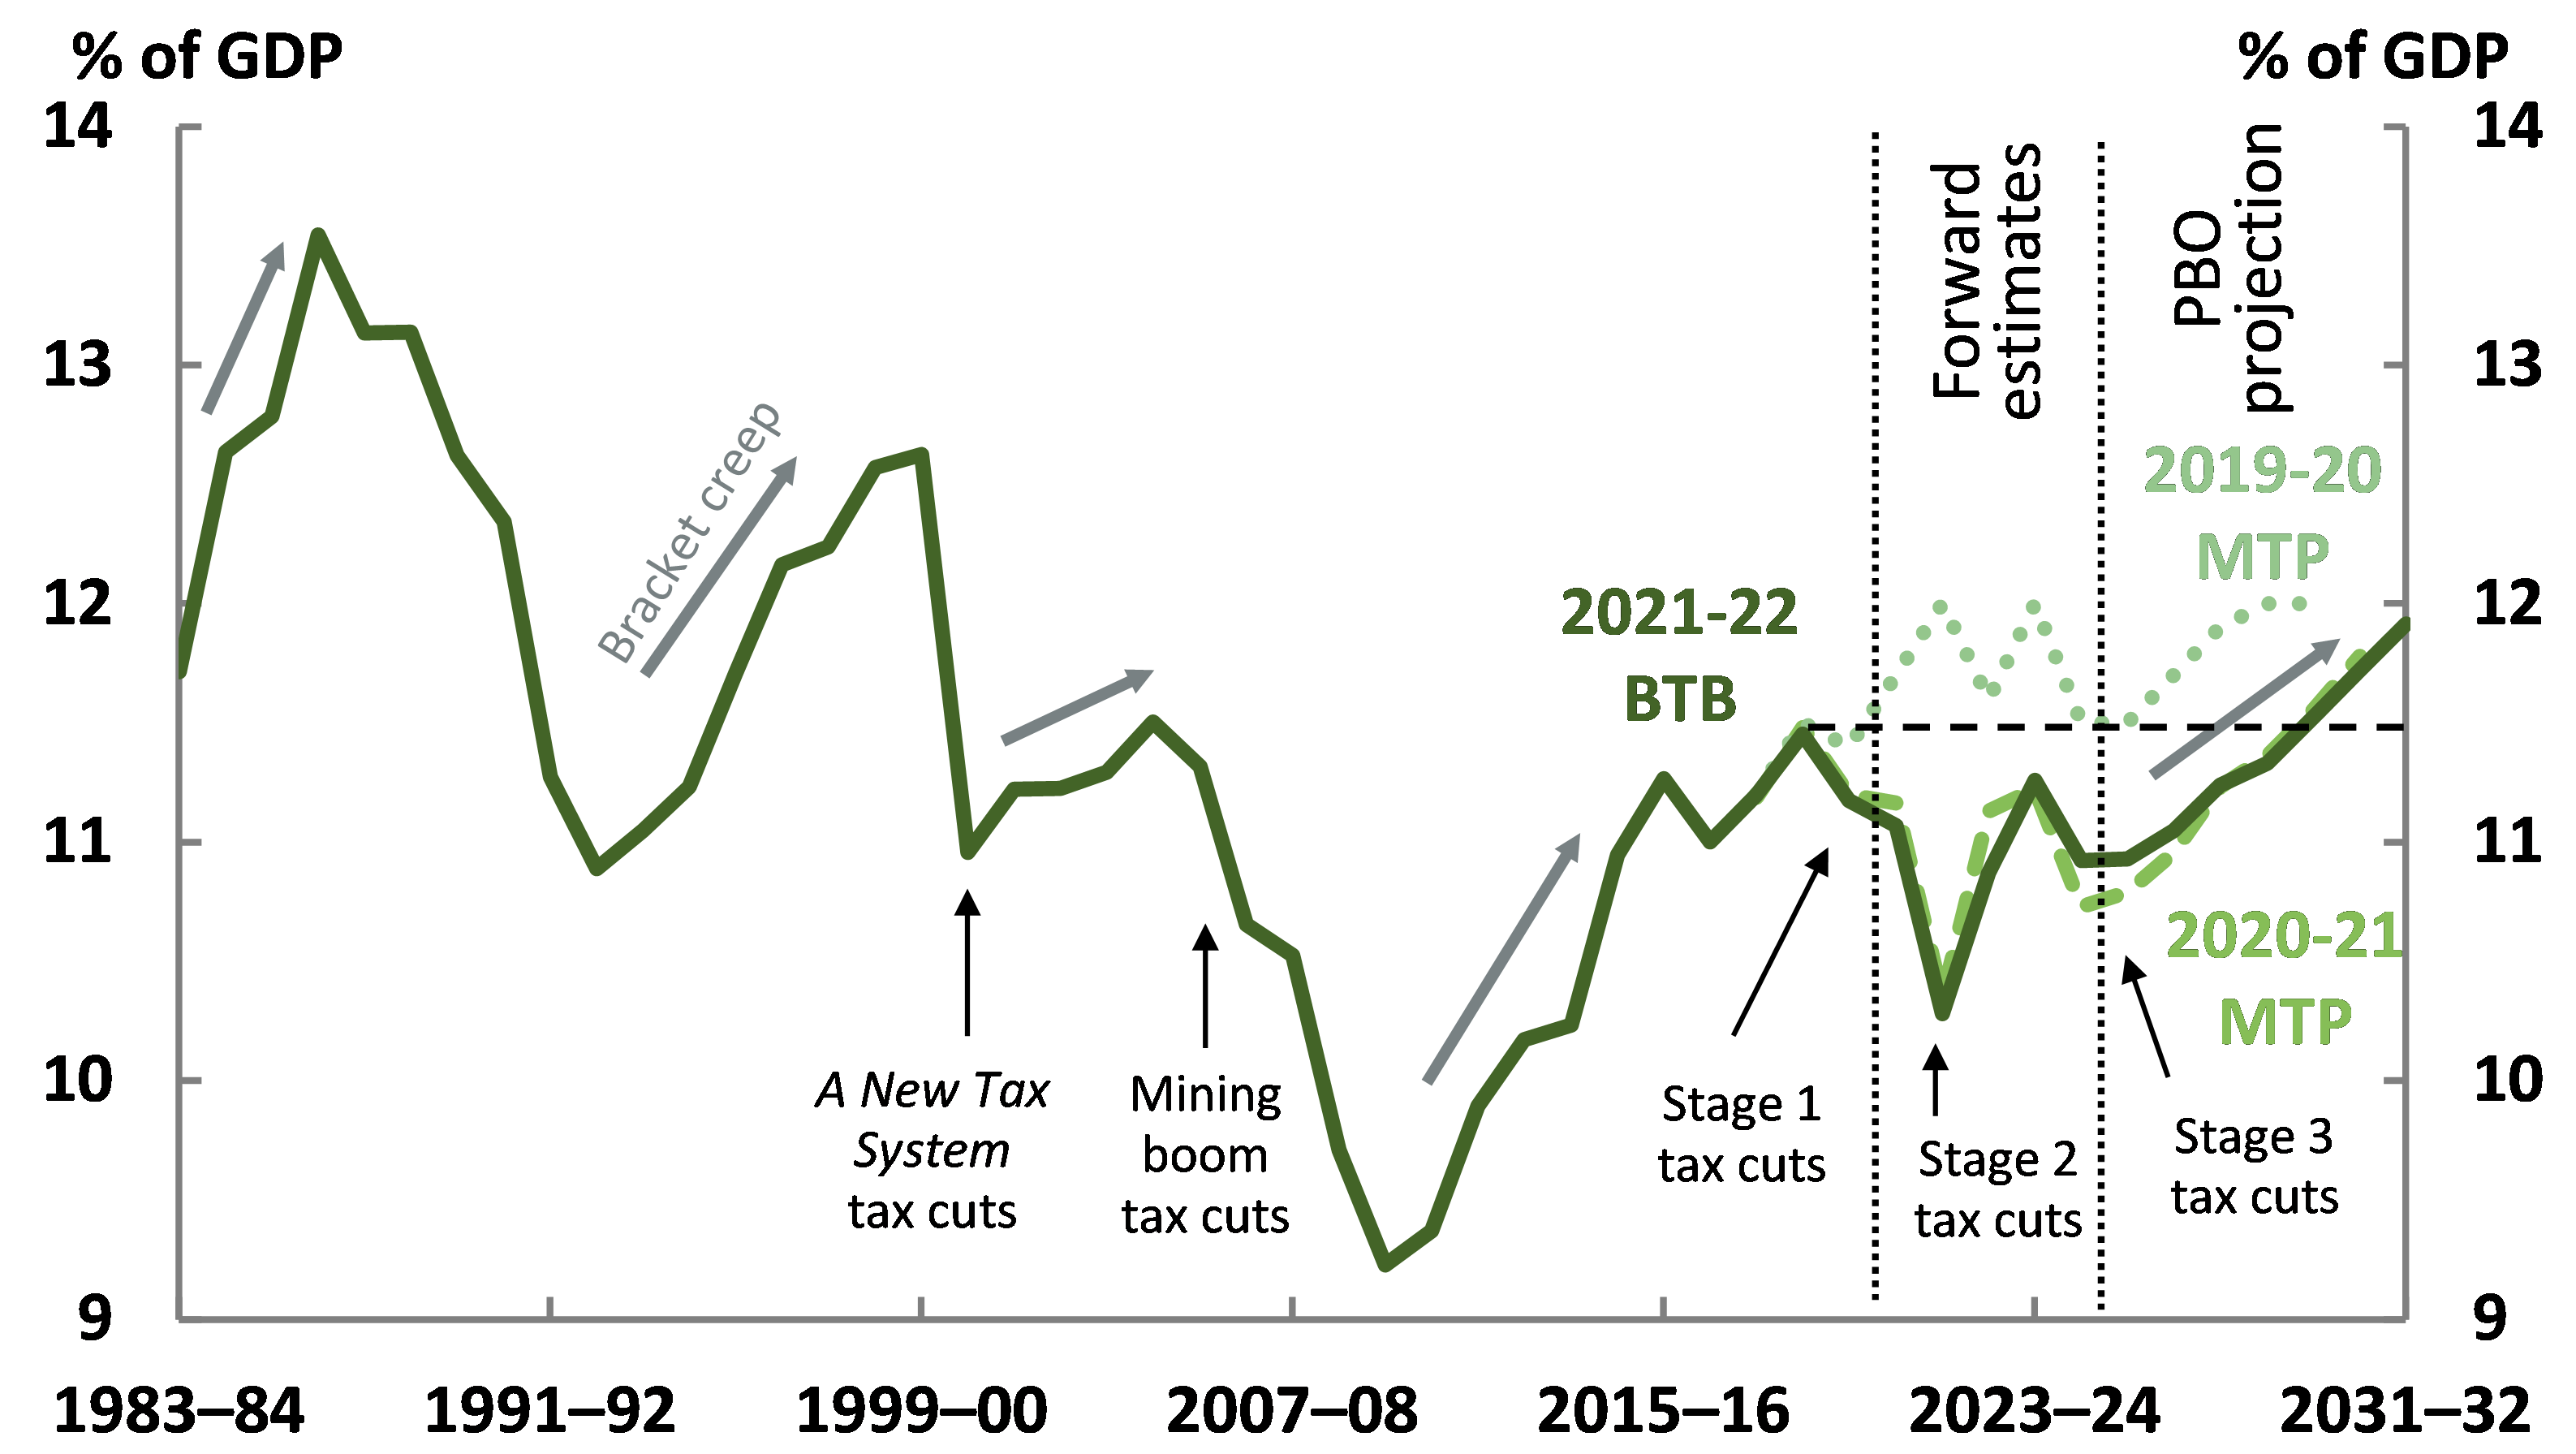
Personal income tax risks are directly linked to any future changes in personal income tax policy and changes to the economic forecasts. Over the past 40 years, for example, the history of personal income tax receipts as a share of GDP has reflected the implementation of various tax cuts and economic shocks, as well as bracket creep (Figure 4-13). The forecast profile of personal income tax over the forward estimates period reflects the Government’s implementation of stages 2 and 3 of the Personal Income Tax Plan.
The PBO’s projections are based on the policy settings underlying the 2021-22 Budget and assume no change to these settings over the medium term. As such, the projections assume no change to personal tax rates or thresholds beyond 2024-25, the last of the changes announced by the Government. This means that, over the medium term, the PBO projects personal income tax receipts to trend upwards due to bracket creep.
The PBO projects personal income tax receipts to increase from 10.3 per cent of GDP in 2021-22 to 11.9 per cent of GDP in 2031-32, 0.5 percentage points higher than in 2018-19. When compared to last year’s projections, personal income tax receipts have been revised upwards by $37 billion over the four years to 2024-25. This upwards revision is driven by a faster-than-expected rebound in the labour market.
The distributional effects of the income tax cuts by income and gender are discussed in Box 5.
| Figure 4-13: Personal income tax |
| 1983-84 to 2031-32 |
 |
| Note: The dashed horizontal line shows the 2018-19 levels for comparison. |
| Source: 2021-22 Budget and PBO analysis. |
|
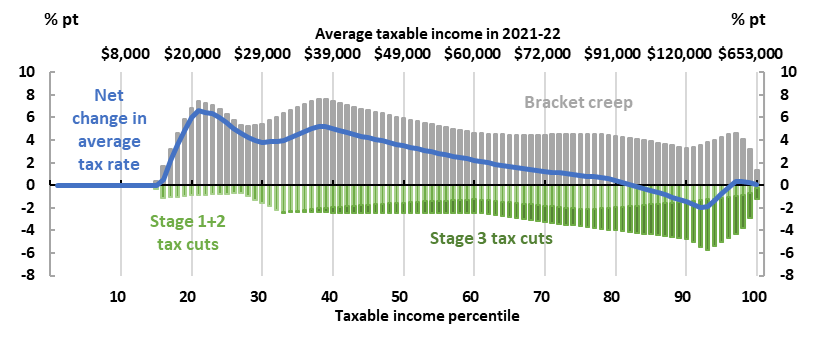
Box 5: Distribution of personal income tax changes by income and gender The government’s Personal Income Tax Plan, originally announced at the 2018-19 Budget, includes three stages, with the first stage introduced in 2018-19, and the second in 2020-21 (brought forward two years as part of the government’s JobMaker Plan). The final stage is legislated to come into effect in 2024-25.33 Countering these tax cuts, bracket creep, driven by ongoing growth in wages, will have the effect of increasing average personal income tax rates. The overall change in average tax rates is the combination of both bracket creep and tax cuts. Figure 4-14 shows the projected change in average tax rates between 2021-22 to 2031-32 across Australian taxpayers, taking all three stages of the Personal Income Tax Plan into account, and broken down into percentiles each representing 1 per cent or approximately 150,000 individuals. This allows for a comparison of where a specific taxable income sits relative to others.34 For example, an individual earning $91,000 in 2021-22 is earning at the 80th percentile, meaning that this person earns more than that earned by 80 per cent of Australian taxpayers. Only those earning between the 83rd and 96th percentiles (individuals earning between $96,000 and $168,000 in 2021-22) are projected to have lower average tax rates in 2031-32 compared to 2021-22. For other taxpayers, bracket creep is expected to more than counter the impact of all three stages of the tax cuts over the next decade.
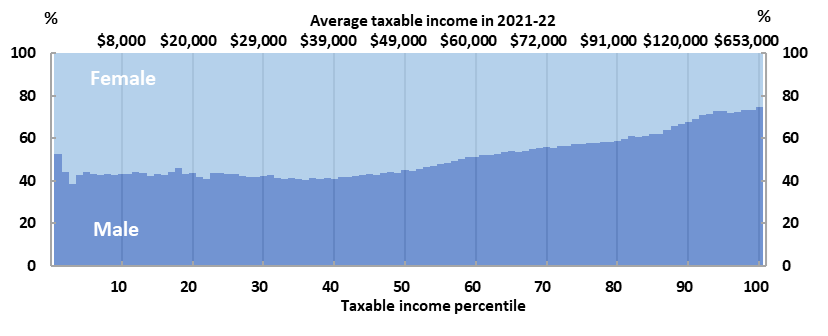
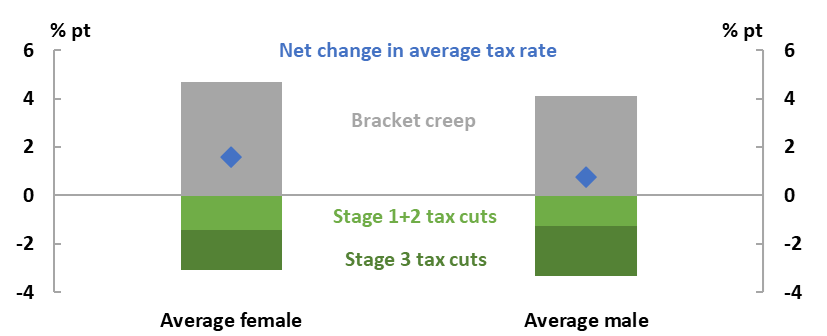
The impact of bracket creep is not uniform. Lower income earners, particularly those earning between $20,000 and $50,000 in 2021-22 (the bottom 20 to 50 per cent of income earners) experience the largest impacts from bracket creep. This is because most of their income increase over the next decade will be taxed at a marginal rate much higher than their current average tax rate, resulting in an increase to their average tax rate of between 5 and 8 per cent. Tax cuts reduce the impact of bracket creep by between 0.7 and 3 per cent for this group. Females make up a majority of taxpayers earning between $20,000 and $50,000, mainly reflecting a higher prevalence of part-time or part-year work, while the proportion of male taxpayers increases with income (Figure 4-15). On average, both men and women are expected to pay a higher average tax rate in 2031-32 than they do in 2021-22 even with the tax cuts, but men are projected to pay an average of 0.8 percentage points more compared to a 1.6 percentage point increase for women (see Figure 4-16). The main driver of this difference is bracket creep. The impact of the tax cuts is only marginally higher for male taxpayers (a greater impact from stage 3 is partially offset by a lower impact from stages 1 and 2). Despite the increases in average tax rates for men and women, men will pay a higher average level of income tax, as the proportion of male taxpayers increases with income.
|
4.3.3 Projecting National Disability Insurance Scheme costs
The NDIS is a relatively new insurance scheme providing support for Australians with a permanent and significant disability, under which many participants are receiving support for the first time. The NDIS is the largest contributor to the growth of total payments over the medium term, and the 2021-22 Budget shows combined (Commonwealth plus state and territory) expenses are estimated to exceed those for medical benefits under Medicare by 2024-25. 35
Payments under the NDIS are determined by two drivers: the number of participants and the average payment per participant. While there is uncertainty associated with projecting the cost of most government programs, the uncertainty in projecting NDIS costs over the medium term is greater than for most other programs for two main reasons.
Firstly, as a new program, there is limited historical information to draw on when developing projections. The NDIS was built on trials that started in 2013. Geographic roll-out of the full scheme started in July 2016 and finished in July 2020. As such, participant growth data from this period will not be typical of the level of growth that will apply going forward, especially once most eligible people have been in the scheme for some time. Nonetheless, during this period, participant numbers and the average cost per participant have grown rapidly. As described in the NDIS Scheme Actuary’s Annual Financial Sustainability Report—Interim Update released on 3 July 2021, this trend is expected to continue.36 It is not easy to predict when this growth will stabilise and at exactly what level. Even in NDIS service districts such as Newcastle and Barwon where the Scheme has been in place since 2013, participant growth is still well above general population growth, for example increasing by 13 per cent in 2019-20.37 In the three years to 2020-21, the average payment per participant across all sites has increased by 11.8 per cent per year to $54,300. 38
Secondly, most government programs have more predictable participation rates and costs per person than the NDIS. For example, social welfare payments feature tightly defined eligibility rules and specified rates of payment. They are indexed by economic parameters such as the consumer price index and as a result, the degree to which they vary year to year is constrained.
In contrast, the number of potentially eligible NDIS participants depends on the nature and prevalence of eligible conditions—that is, permanent and significant disability or a developmental delay—and the budget each participant receives depends on their individual circumstances, which varies widely across participants.39 In addition, participants’ use of their planned budget tends to increase with time in the NDIS as they understand the scheme and services available. For example, new participants only used an average of 44 per cent of their first planned budget, while use of fourth plan budgets averages 73 per cent.40
While some earlier estimates of NDIS spending were overestimates, due to participant enrolments being slower than projected, more recent budget and Scheme Actuary projections have both undergone significant upwards revisions (Figure 4-17). In the 2021-22 Budget, the significant upwards revision to NDIS payments over the forward estimates reflected higher participant numbers and higher average costs than previously forecast. The Scheme Actuary’s July 2021 Interim update projects higher average costs, and growth in participants that is well above population growth to 2029-30.
| Figure 4-17: Actual and projected NDIS costs |
| 2016-17 to 2024-25 |
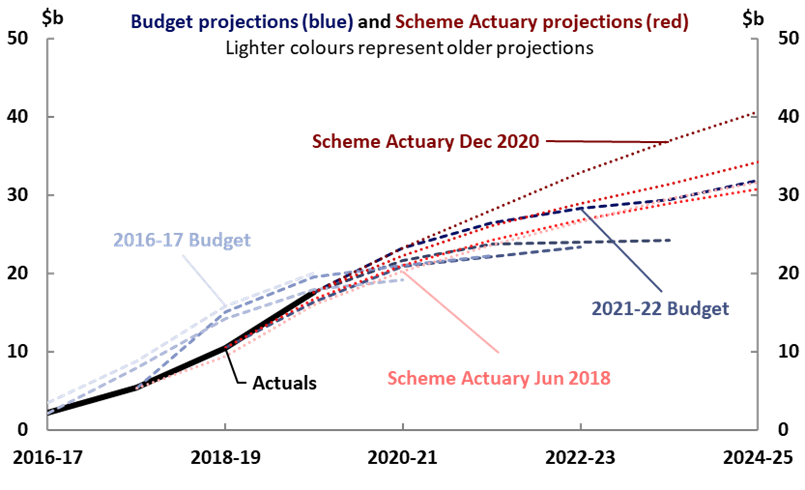 |
| Note: Participant costs from Budget papers are on an accrual basis for consistency with the Scheme Actuary projections. Excludes costs of the National Disability Insurance Agency and NDIS Quality and Safeguards Commission. Scheme Actuary projections are from June 2018, June 2019, June 2020 and December 2020. |
| Source: NDIS Quarterly Report to disability ministers 30 June 2021 pp. 98-100, 2016-17 to 2021-22 Budgets and PBO analysis. |
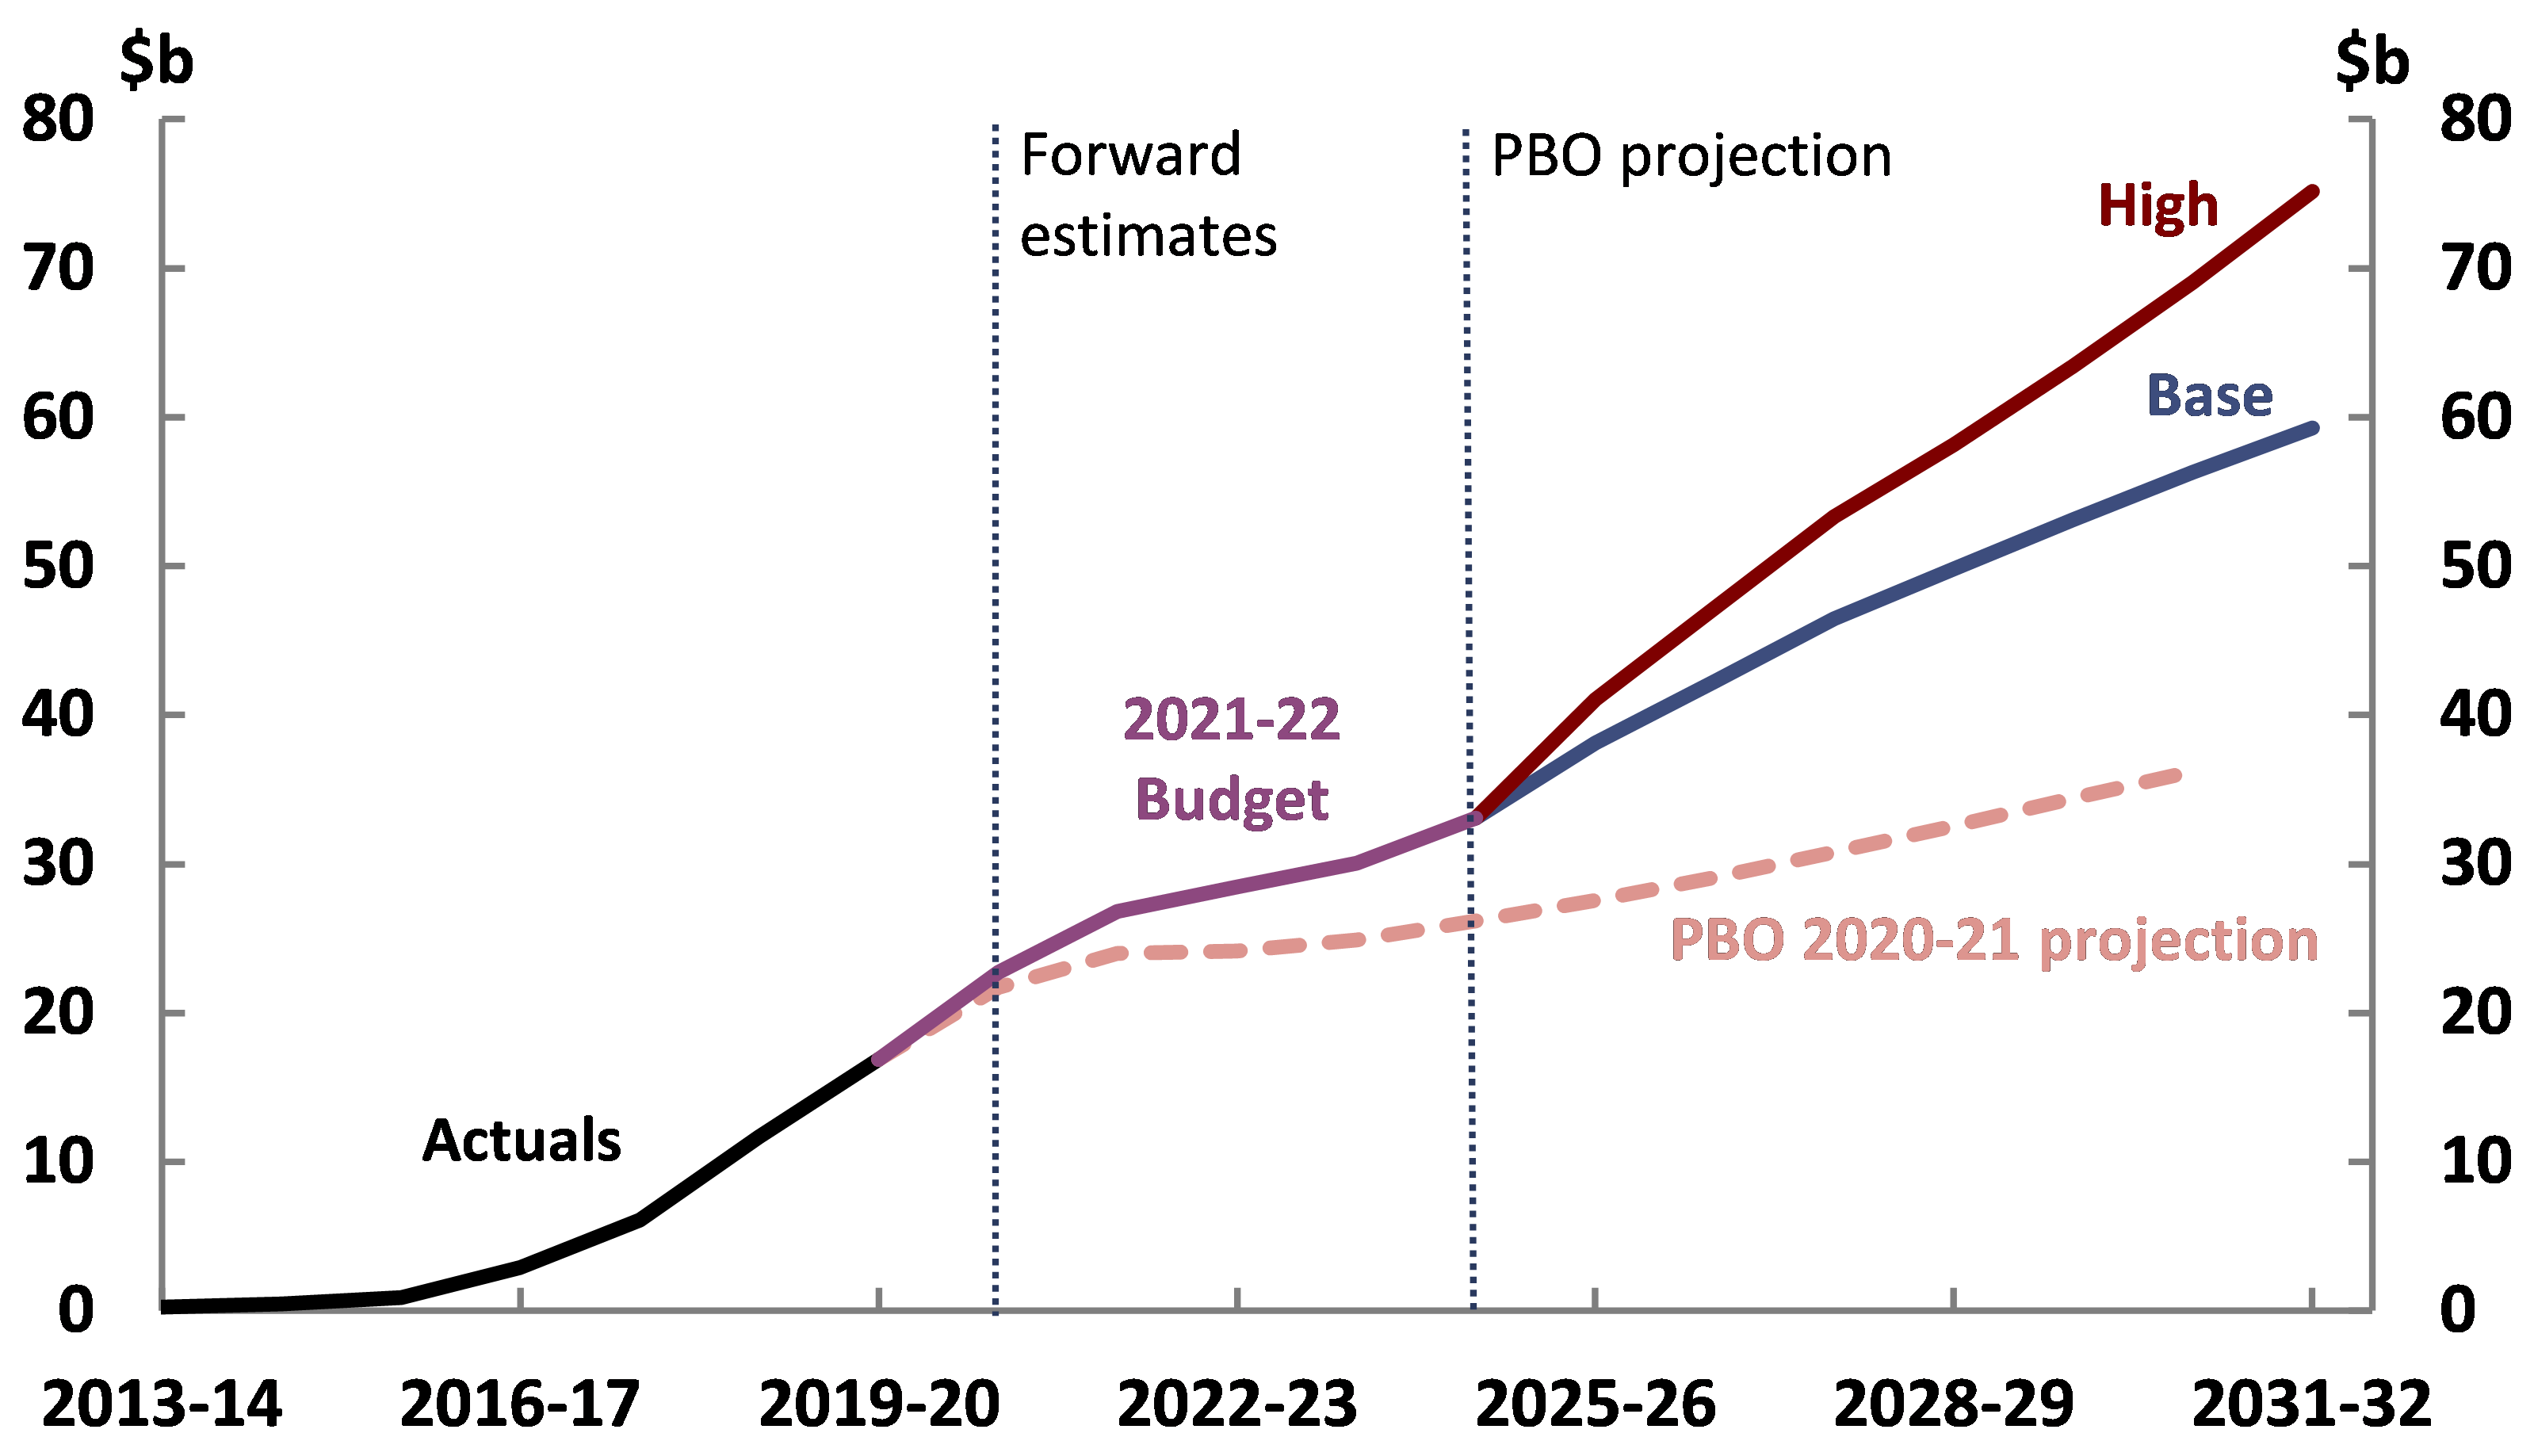
Given this high degree of uncertainty and the importance of the scheme to the overall fiscal position, the PBO has developed two scenarios to illustrate the potential evolution of scheme costs over the medium term (Box 6). Each scenario (base and high) represents a different set of plausible assumptions for how the number of participants and the average cost per participant will grow over time.
Under the PBO’s ‘base’ scenario NDIS payments are projected to increase from 0.6 per cent of GDP in 2018-19 to 1.7 per cent of GDP by 2031-32; this would be 2.2 per cent of GDP under the high scenario. This variation is large enough to have a small but noticeable impact on the projected cost of interest payments on government debt by the end of the medium term: relative to the base scenario, interest payments could be around $1.0 billion (2.7 per cent) higher in 2031-32.
The high scenario should not be interpreted as an upper bound for the projected cost of the scheme—given the uncertainties discussed above, costs could grow faster.41 The NDIS publishes quarterly updates including outcomes on participant numbers and costs, which will help to provide early indications of which of these scenarios might be more likely.42 Going forward, the National Disability Insurance Agency will release Annual Financial Sustainability Reports for the NDIS, along with the peer review of these by the reviewing actuary.43 These, along with the second independent review of scheme costs, due in 2023, will present further opportunities for more detailed exploration of how NDIS costs may grow into the future.
|
Box 6: NDIS payments scenarios We have developed two scenarios to explore plausible outcomes for NDIS payments over the medium term. Our ‘base’ scenario assumes that the number of participants would grow towards the level in 2027-28 projected by the Scheme Actuary, with growth then converging to population growth by 2032-33.44 Participant numbers would exceed 800,000 by the end of the medium term. Average costs per participant are consistent with the 2021-22 Budget over the forward estimates; over the medium term they are grown by a weighted average of wage and price growth, plus an allowance for participants’ increasing use of their budgets as they become more familiar with the options available to them. Average costs per participant reach around $70,000 per year by 2031-32. Our ‘high’ scenario assumes that after the forward estimates period, the number of participants would grow towards the level in 2027-28 projected by the Scheme Actuary, and that the number of participants would then continue to grow at a rate of around 5 per cent each year (population growth plus 4 per cent), with no convergence to population growth over the period to 2031-32. Under this scenario, participant numbers would exceed 900,000 by 2031-32. Average costs in this scenario also grow towards the level in 2027-28 projected by the Scheme Actuary, and are then grown by the same rates used under the base scenario. Average costs per participant under this scenario would be around $79,000 per year by 2031-32. In 2031-32, this gives a range of NDIS payments between $59 billion and $75 billion, as shown in Figure 4-18. The supplementary paper to this report provides further details on the method for this and our other payments and receipts projections.
|
5 Projected receipts and payments
- The PBO’s analysis of receipts and payments by program accounts for around 80 per cent of total receipts and payments.
- Most individual categories of receipts are expected to remain broadly unchanged as a share of GDP over the medium term.
- Looking across payment categories, the picture is more mixed. Some programs— particularly some social welfare payments—represent a smaller share of the economy over time, while others such as aged care, defence and the NDIS expand as a share of GDP.
Budget balances are simply the overall outcome of movements in their components: for example, the underlying cash balance is the difference between the government’s receipts and payments. 45 Chapter 4 presented projections for the overall budget position and examined key drivers and risks. It included discussions of the trends in personal income tax and the NDIS, given their importance to the fiscal position. This chapter looks below these aggregates and key drivers to provide more detail on many other individual categories of receipts and payments over the medium term. The supplementary paper for these projections contains additional results and describes the modelling approach for each program.
5.1.1 Company tax receipts
The 2021-22 Budget forecasts company tax receipts to dip in 2022-23, due to a drop in iron ore prices from their current elevated prices, before recovering as a share of GDP by 2024-25. The PBO projects company tax to remain stable over the medium term at around 4.4 per cent of GDP, or about 0.1 percentage points higher than last year’s projections. This increase is due to an improved domestic economic outlook.
While company tax receipts over the medium term are projected to improve relative to last year’s projections as a share of GDP, they are projected to remain lower than their pre-pandemic level in 2018-19 of 4.8 per cent of GDP. Company tax receipts were particularly strong in 2018-19, when they reached their highest rate as a share of GDP since the Global Financial Crisis, consistent with strong prices for key commodities such as coal and natural gas. Our projections for company tax are broadly in line with the long-run trend.
5.1.2 Goods and services tax receipts
Compared to the previous report, projected GST receipts have been revised upwards by $21 billion over the four years to 2024-25. Over the medium term, the PBO projects GST receipts to stabilise at around 3.4 per cent of GDP, or around 0.1 per cent higher as a share of GDP when compared to last year’s projections. The improvements over the forward estimates period and the medium term reflect the recovery in the economy and household consumption.
Changes to projections of GST receipts will not affect the overall Commonwealth budget balance, as the GST is entirely paid to the states and territories. Total GST payments (see Table 5-2) include GST top-up payments introduced under a transitional guarantee with state and territory governments, which reduce the Commonwealth’s budget balance.
5.1.3 Other receipts
Table 5-1 shows the PBO’s projections of the change in receipts by each major category over the period 2018-19 to 2031-32 and their projected contribution to growth in total receipts. It shows that most individual categories of receipts are expected to remain broadly unchanged as a share of GDP over the medium term.
| Table 5-1: Comparison of receipts |
| 2018-19 and 2031-32 |
| Note: Numbers may not sum due to rounding. In previous medium-term fiscal projections reports, the base year of comparison has been the year prior to the budget year, which for this report would be 2020-21. However, the years 2019-20 and 2020-21 were unusual due to the COVID-19 pandemic and associated policy response. In order to compare against a more typical base year, this table uses 2018-19 as the comparison year. |
| Source: 2021-22 Budget and PBO analysis. |
The PBO’s payments projections are based on individual analysis of 23 major program areas. Projections of payments generally assume policy settings and arrangements as contained in the budget estimates.46 Payments outside of the 23 major programs account for around 20 per cent of total payments, with the exception of 2019-20 and 2020-21 where many payments related to COVID-19 were delivered outside of major ongoing programs. The discussion in this report covers around 50 per cent of payments by value, focusing on large and/or growing areas of expenditure.
The change in projected payments between 2018-19 and 2031-32 is shown in Figure 5-1.
The largest increases in payments as a share of GDP are projected for the NDIS, aged care and defence.
Decreases as a share of GDP are projected for some payments to individuals such as Family tax benefit. The decreasing shares of GDP for these payments result from two broad factors. Firstly, income eligibility thresholds for payments often increase at a rate lower than wages growth, reducing the number of eligible recipients of some payments over time. Secondly, indexation for the payment rate of most programs is lower than GDP growth, tending to reduce the size of payments as a share of GDP.
| Figure 5-1: Projected change in payments as a share of GDP |
| 2018-19 to 2031-32 |
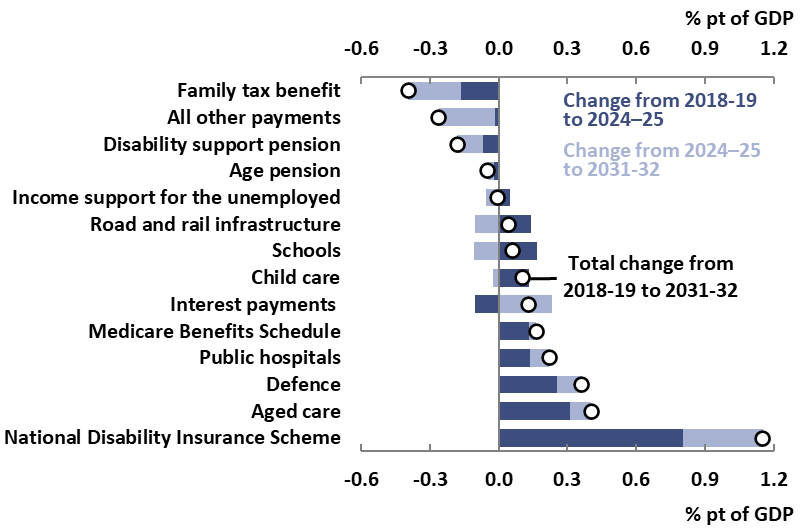 |
| Note: ‘All other payments’ includes the total of all payments programs not separately identified in this chart. |
| Source: 2021-22 Budget and PBO analysis. |
5.2.1 Payments to individuals
Payments to individuals, which includes Income support for the unemployed, the Disability support pension, the Age pension, Family tax benefit, Carer income support, and the Parenting payment, are projected to decrease by 0.7 percentage points as a share of GDP between 2018-19 and 2031-32.
While recipient numbers for Income support for the unemployed (largely JobSeeker Payment) are projected to decline over the forward estimates as the economy recovers, the risk of future COVID-19 outbreaks and the associated economic impacts could result in recipients remaining on the payment for longer. At the time of drafting this report, with the Delta variant outbreak across much of the country, mutual obligations have been temporarily waived for affected areas, which may result in some recipients staying on welfare payments for longer. Similarly, Parenting payment spending spiked during the onset of the COVID-19 pandemic due to increases in eligibility as incomes fell and mutual obligation requirements were temporarily relaxed, with recipient numbers projected to fall from this peak.
Over the medium term, total payments to individuals are expected to fall as a share of GDP. For example, the Family tax benefit will be expected to fall as a share of GDP across the medium term in line with longer trends of eligibility thresholds for payments increasing at a rate lower than wages growth and indexation of the payment level at rates lower than nominal GDP growth.
The Age pension is projected to rise from 2.4 per cent of GDP in 2018-19 to 2.6 per cent of GDP in 2020-21, before falling to 2.3 per cent of GDP in 2031-32. While the population will continue to age over the decade, this will be increasingly moderated by the maturation of the superannuation system.47 As a result, older Australians are projected to have more income and assets over time, resulting in falling eligibility for the Age pension amongst the population aged over pension eligibility age and falling eligibility for the full rate pension amongst those eligible.
5.2.2 Defence
Defence payments are projected to increase by 0.4 percentage points as a share of GDP from 2018-19 to 2031-32, from 1.9 per cent of GDP to 2.3 per cent of GDP. This is due to an increase in defence funding over time, reflecting the Government’s funding commitments in the 2016 Defence White Paper and the 2020 Defence Strategic Update. Uncertainty remains around the projections in individual years, given that the acquisition of military equipment is inherently ‘lumpy’ in nature and can be subject to changes in the timing of delivery. As with all other medium-term projections in this report, the defence projection is based on current policies at the time of the 2021-22 Budget, so does not include the announcement of 16 September 2021 for Australia to acquire nuclear-powered submarine technology.
5.2.3 Aged care
Aged care payments are projected to grow from 1.0 per cent of GDP in 2018-19 to 1.5 per cent of GDP by 2031-32, strongly driven by the ageing population’s demand for aged care services. When compared to last year’s projections, aged care payments are expected to be 0.1 percentage points higher as a share of GDP in 2030-31. This is due to the measures in the 2021-22 Budget’s $17.7 billion reform package responding to the Royal Commission into Aged Care Quality and Safety, including an additional 80,000 home care packages by 2022-23 and improvements in care outcomes for aged care residents through a new funding model including ongoing support for providers to deliver better care and services.
5.2.4 Child care
Child Care Subsidy payments are projected to increase by 0.1 percentage points of GDP between 2018-19 and 2031-32. When compared to last year’s projections, child care payments are projected to be 0.1 percentage points higher in 2030-31, increasing from 0.4 per cent of GDP to 0.5 per cent of GDP. This is due to 2021-22 Budget measures to increase the maximum Child Care Subsidy rate for second and subsequent children from 85 per cent to 95 per cent, and to remove the annual cap on the subsidy per child.
5.2.5 Infrastructure
Road and rail infrastructure payments as a share of GDP are projected to decline from their peak within the forward estimates to 0.4 per cent of GDP by the end of the medium term, just above their 2018-19 share. This reflects a decline in spending as currently announced projects are completed, and the PBO’s assumption that new road and rail infrastructure projects would continue to come on line at a rate consistent with recent history.
5.2.6 Contingency reserve
The Contingency reserve is an allowance within the budget for policy changes or other items that the government expects but cannot allocate to specific government programs or publish separately in the budget. Its purpose and operations can sometimes be misunderstood; to support public understanding, the PBO plans to publish a paper analysing trends and components of the contingency reserve over time.
A range of items may be included in the Contingency reserve, including: the ‘conservative bias allowance’; items that are too sensitive to be published, such as those that are commercial-in-confidence or have national security sensitivities; a provision for underspends in the current financial year; decisions taken but not yet announced at the release of the budget; items still under negotiation with other entities such as state and territory governments; measures or parameter variations received too late for inclusion in the budget; and provisions for other specific events and pressures that are expected to affect the budget estimates but cannot be easily attributed to a particular portfolio.
The conservative bias allowance is typically the largest component of the Contingency reserve, and accounts for an observed tendency for the costs of some existing government programs to be higher than estimated. The conservative bias allowance is calculated as a percentage of total payments (excluding GST payments to the states) in each of the forward years.
In the 2021-22 Budget, the conservative bias allowance provision was $18.3 billion over the forward estimates period, while the remainder of the reserve provision was $19.2 billion. While the particular contents of the contingency reserve are not publicly available, $8.3 billion of the remaining provision over the forward estimates is listed under the payments component of ‘decisions taken but not yet announced’ in Budget Paper 2.
Because the itemised contents of the contingency reserve are unknown, the PBO’s projections assume that the amounts allocated to the Contingency reserve, including the conservative bias allowance and the additional provisions, grow with nominal GDP over the medium term.
5.2.7 Other payments
Table 5-2 shows the PBO’s projections of the change in payments by each major program over the period 2018-19 to 2031-32.
| Table 5-2: Comparison of payments by key program area |
| 2018-19 and 2031-32 |
| Note: Numbers may not sum due to rounding. In previous medium-term fiscal projections reports, the base year of comparison has been the year prior to the budget year, which for this report would be 2020-21. However, the years 2019-20 and 2020-21 were unusual due to the COVID-19 pandemic and associated policy response. In order to compare against a more typical base year, this table uses 2018-19 as the comparison year. The contingency reserve provision is always equal to zero in actual estimates. |
| Source: 2021-22 Budget and PBO analysis. |
Appendix
For more explanation of these and other terms, see the PBO’s Online budget glossary.
Accrual accounting - Accrual accounting records income when it is earned, and records costs when they are incurred, regardless of when the related cash is received or paid. Under accrual accounting, government income is called ‘revenue’ and costs are generally called ‘expenses’. As an example, under accrual accounting, goods and services tax revenue is recorded in the financial year that the goods and services are purchased, even though the government may not receive the related tax amounts until the following financial year.
Cash accounting - Cash accounting records income when cash is received, and records costs when cash is paid out, regardless of when those amounts are earned or incurred. For example, under cash accounting, goods and services tax receipts are recorded in the financial year they are received, even though those tax amounts may relate to goods and services purchased in the previous financial year. Under cash accounting, government income is called ‘receipts’ and costs are called ‘payments’.
Expenses - Expense in the budget context refers to the cost of providing government services, excluding costs related to revaluations such as the write down of assets. Examples include spending on programs such as the age pension or Medicare, funding provided to the states and territories for public hospitals, or the wages paid to Commonwealth Government employees.
Fiscal balance - The fiscal balance is an accrual accounting measure of the budget balance equal to the government's revenue (for example from taxes) minus its expenses (from providing services such as Medicare and income support such as the age pension), adjusted for government capital investments such as military equipment (known as 'net capital investment in non-financial assets') when they are acquired or sold.
Fiscal sustainability - The government’s ability to maintain its long-term fiscal policy arrangements indefinitely, without the need for major remedial policy action. A fiscally sustainable position is one which can be maintained while pursuing similar borrowing and repayment approaches over the long term, such as that taxation and spending can be expected to operate within reasonable and expected bounds.
Gross debt - In the budget papers, gross debt is the sum of interest bearing liabilities, mainly consisting of Australian Government Securities on issue, based on their value when the securities were issued (their 'face value'). Gross debt does not include any of the government’s financial assets that partly offset that debt, or any smaller debts that are not Australian Government Securities.
Headline cash balance - The headline cash balance (HCB) is a cash measure of the budget balance equal to the government's receipts (for example from tax collections) minus payments for operations and investment activities (including certain investments in financial assets). If receipts are lower than payments, the headline cash balance is in deficit, meaning the government does not have sufficient cash to cover its activities and has to borrow from financial markets.
Net debt - Net debt is the sum of selected financial liabilities (deposits held, advances received, government securities, loans and other borrowings) less the sum of selected financial assets (cash and deposits, advances paid, and investments, loans and placements). It is a common measure of the strength of a government’s financial position. In the net debt calculation, Australian Government Securities are valued as the price they are currently trading at (their 'market value') rather than their value when the securities were issued (their 'face value').
Net financial worth - Net financial worth measures the total financial assets (such as cash or shares in a company) held by a person or organisation at a fixed point in time, minus the value of any liabilities, such as outstanding debts. Net financial worth is a broader measure of the government's financial position than net debt, but it is narrower than net worth.
Net worth - Net worth measures the government’s overall wealth, calculated as total assets (both financial and non-financial) less total liabilities. Net worth is the broadest measure of the government’s financial position.
Payments - Payments capture all outgoing cash transactions from the Commonwealth Government to individuals, organisations or other levels of government. In the budget context, payments are those that affect the underlying cash balance and comprise cash transactions for operating activities and the purchase of non-financial assets. Examples include an age pension payment, a Medicare rebate for a doctor's visit, and the wages of a Centrelink employee.
Interest payments - Interest payments are the cash payments on the government’s debt liabilities which are recorded as a cost to government in the budget. Net interest payments are equal to interest payments minus the cash interest receipts earned by the government on investments in interest-bearing financial assets.
Receipts - Receipts are the government's income, recorded at the time they are received as reported on a cash accounting basis. In the budget context, receipts are those that affect the underlying cash balance, so exclude the repayment of loans and other cash flows relating to the exchange of financial assets. The majority of government receipts are tax receipts, such as company tax, personal income tax, and goods and services tax. The government also receives non-tax receipts, such as interest earned on government loans and dividends from government investments.
Revenue - Revenue is government income, recorded at the time it is earned as reported on an accrual accounting basis. The majority of government income is made up of tax revenue, such as company tax, personal income tax, and goods and services tax. The government also receives non‑tax revenue, such as interest earned on government loans and dividends from government investments.
Underlying cash balance - The underlying cash balance (UCB) is a cash measure of the budget balance equal to the difference between the government's receipts and its payments. It is one of several indicators known as ‘budget aggregates’ that measure the impact of the government's budget on the economy. When the government or the media say the budget is in surplus or deficit, they are generally referring to the underlying cash balance, or sometimes the net operating balance or fiscal balance. More specifically, the underlying cash balance is equal to the government's receipts (for example from tax collections) minus its payments from providing services (such as Medicare) and support (such as the age pension). The types of receipts and payments used in the calculation include those from buying and selling non‑financial assets, such as buildings or equipment. The term 'underlying' is used because it excludes some cash transactions that are captured in the broader, but less commonly used, headline cash balance.
- This is the sixth edition of the publication formerly called the Medium-term fiscal projections report. It has been renamed to reflect the expanded contents, particularly the inclusion of an annual fiscal sustainability assessment which uses scenario analysis
- The medium term (the current budget year plus the next ten years) is comprised of two sub-periods, the four-year ‘budget forward estimates period’ (currently 2021-22 to 2024-25) and the medium-term projections period (2025-26 to 2031-32). The ‘budget estimates period’ includes the pre-budget year (currently 2020-21).
- Reserve Bank of Australia, Statement on Monetary Policy, August 2021, p. 1.
- Reserve Bank of Australia, Statement on Monetary Policy, August 2021, p. 1.
- PBO Data portal
- For further discussion see PBO report no. 01/2020, Alternative financing of government policies: Understanding the fiscal costs and risks of loans, equity injections and guarantees
- The PBO will continue to expand its focus on balance sheet measures and projections to assist Parliament and the public to understand and scrutinise the budget. The projections in this chapter use the PBO’s new balance sheet projections framework which is outlined in the supplementary paper to these projections. We intend to publish a more detailed set of medium-term financial statement projections and additional balance sheet explainer pieces in future.
- In previous medium-term fiscal projections reports, the base year comparison points have been the year prior to the budget year and the previous year’s report, which for this report would be 2020-21 and the 2020-21 medium-term projections report, respectively. However, the years 2019-20 and 2020-21 were unusual due to the COVID-19 pandemic and associated policy response. In order to focus on the longer-term effects of the pandemic on the budget, this report uses the 2019-20 medium-term projections report (published in September 2019) or the 2018-19 financial year as comparison points.
- Reserve Bank of Australia, Statement on Monetary Policy, August 2021, p. 75.
- See section 2.3 of the Supplementary paper to these projections for a brief explanation of this rule of thumb approach.
- The market value of bonds moves in the opposite direction to their yield (interest rate). For example, suppose many investors choose to sell a particular bond so there is downward pressure on the price (the market value of the bond). The difference between the market value of the bond and the principal due at maturity (the face value of the bond) will increase, which increases the interest received.
- PBO report 01/2021 (Fiscal sustainability), April 2021.
- Gross debt is the amount of money that a government owes its lenders at a particular point in time. It is conceptually simpler for scenario analysis than net debt, which adjusts for the value of financial assets, and has historically followed a similar trajectory. For further detail on what is captured by each debt measure see the PBO Online Budget Glossary. For a direct comparison see Box 2 of the PBO report Fiscal sustainability.
- The downside scenario assumes productivity growth of 1.2 per cent, based on an estimated 25 year rolling average if productivity growth remains at 0.5 per cent for the next three years.
- For a comparison of this approach with that of the Intergenerational Report, the medium-term projections in this report, and the budget papers, as well as further detail on the methodology and assumptions underpinning each scenario, see the supplementary paper published with this report.
- See the PBO Data portal.
- Compared to our pre-budget Fiscal sustainability report, the trajectory of the debt-to-GDP ratio under each scenario is broadly unchanged. This is mainly due to a similar gap between the economic growth and interest rate assumptions. While we now project gross debt to be lower at the end of the medium term, this represents only a small variation in our results over the 40-year scenario period.
- See for example Pescatori, A. Sandri, S. and Simon, J. 2014, No Magic Threshold, International Monetary Fund Finance and Development Vol. 51, No. 2, pp. 39-42.
- Reserve Bank of Australia, Statement on Monetary Policy, August 2021, p. 29.
- Accrual accounting records income when it is earned, and records costs when they are incurred, regardless of when the related cash is received or paid. For further information on the fiscal balance or other budget terms, see the Glossary in this report or the PBO’s online budget glossary.
- Total receipts are equal to tax receipts plus non-tax receipts. The tax cap does not apply to non-tax receipts.
- 2021-22 Budget, Budget paper 1, p. 231.
- 2021-22 Budget, Budget paper 1, Statement 2, Box 2.5, p. 45.
- Reserve Bank of Australia, Statement on Monetary Policy, August 2021, pp. 69-77.
- 2021 Intergenerational Report, p. 45, p. 47.
- OCED, OECD Economic Survey: Australia, 2021, p. 11, p. 13.
- 2021 Intergenerational Report, p. 105.
- Most of the estimated reduction in net overseas migration in 2020-21 (see 2021-22 Budget, Budget paper 3, p. 104) will likely be due to lower temporary migration (see ABS, Migration, Australia, 2019-20, previously cat. no. 3412.0); about one fifth of all temporary migrants become permanent within 15 years (PBO calculation from Grattan Institute, Rethinking permanent skilled migration after the pandemic, 2021, pp. 10-11 and ABS, Migration, Australia, 2019-20).
- The Productivity Commission’s 2016 inquiry report Migrant intake into Australia finds (p.333) that if net overseas migration remained at its long-run average level with the current young age structure, then GDP per person in 2060 would be around 7 per cent higher than a zero net overseas migration case, with these benefits ‘highly dependent on having a system that attracts young and skilled immigrants’.
- Permanent migration includes humanitarian migration, which is part of Australia’s international obligations. Humanitarian migrants receive more transfers than taxes over their lifetime than the general population of Australians
- Lowe, P, ‘The Labour Market and Monetary Policy’, speech to the Economic Society of Queensland, 8 July 2021.
- 2021 Intergenerational Report, p. 20.
- The 2018-19 Budget included the Government’s Personal Income Tax Plan, and the 2019-20 Budget included Lower taxes for hard-working Australians: Building on the Personal Income Tax Plan. The 2020-21 Budget adjusted the tax plan timing with the measure JobMaker Plan—bringing forward the Personal Income Tax Plan and retaining the low and middle income tax offset. The 2021-22 Budget extended the middle income tax offset for a further year.
- The distribution of taxable income differs from a distribution of average wages, even for those whose entire income is wages. For example, a distribution of taxable income will include an individual who started work on 1 June at a yearly salary of $60,000, but earning wages for only one month of that financial year. In this case the individual’s wage income on their tax return will be $5,000 rather than $60,000 and the individual will appear below the 10th percentile rather than around the 60th percentile. For a distribution of full-year income only, the percentile incomes would be significantly higher.
- See 2021-22 Budget Paper 1, Table 6.3.1 for total NDIS expenses over the forward estimates. The NDIS is funded by both the Commonwealth and state and territory governments. However, contributions from the states and territories, which are estimated to cover around 40 per cent of payments over the 2021-22 forward estimates, are treated as Commonwealth revenue. This means that Commonwealth payments for the NDIS in the budget include the full cost of the scheme. This is different from the Commonwealth’s payments for schools and hospitals published in the budget, for example, where payments only reflect the Commonwealth contribution.
- Johnson, S. 2021, Annual Financial Sustainability Report Summary—interim update July 2021. Commonwealth, state and territory disability ministers have asked for further work to be undertaken in order to understand the assumptions and the cost drivers underpinning this report, with an interim report due back to ministers in October 2021, see Disability Reform Ministers’ Meeting Communiqué, 13 August 2021.
- NDIS Quarterly Report to disability ministers 31 March 2021, p. 16.
- NDIS Quarterly Report to disability ministers 30 June 2021, p. 17.
- For example, the average annualised payment was $320,800 for Supported Independent Living (SIL) participants and $38,000 for non-SIL participants in 2020-21. NDIS Quarterly Report to disability ministers 30 June 2021, p. 17.
- NDIS Quarterly Report to disability ministers 31 March 2021, p. 13.
- Both the high level of uncertainty and the potential for costs to understate future payments are consistent with the observation made by the Australian Government Actuary in his capacity as peer reviewer of the Scheme Actuary’s Interim Financial Sustainability Report. See the letter from Mr Guy Thorburn, Australian Government Actuary, to Dr Helen Nugent, Chairman, National Disability Insurance Agency, 2 July 2021, p.75 of NDIS Annual Financial Sustainability Report Summary—Interim update.
- NDIS Quarterly Report to disability ministers 2020-21 Q4. As of August 2021, the NDIS is also publishing monthly comparisons of actual participants and costs relative to projections, see NDIS Monthly Summary July 2021.
- Disability Reform Ministers’ Meeting Communiqué, 13 August 2021.
- The Actuary’s Interim update does not publish the projected number of participants and the average cost in every year over the medium term; we have interpolated between projections for 2026-27 and 2029-30 to obtain estimates for 2027-28.
- In addition to reporting budget aggregates on a cash basis (the underlying cash balance), from this edition of the projections, the PBO is also publishing budget aggregates on an accrual basis (the fiscal balance); see section 4.1. Individual heads of receipts and payments will continue to be reported on a cash basis, with accrual estimates to be produced in future.
- For further information on the methodology and assumptions for payment projections, see chapter 5 of the supplementary paper to this report.
- See PBO’s 2019 report, Australia's ageing population: Understanding the fiscal impacts over the next decade for a discussion of the impact of ageing on the budget and Chapter 7.4 of the 2021 Intergenerational Report for a discussion on trends in superannuation and their implications for pension expenditure over the longer term.
