Figure 1A: Underlying cash balance2,3
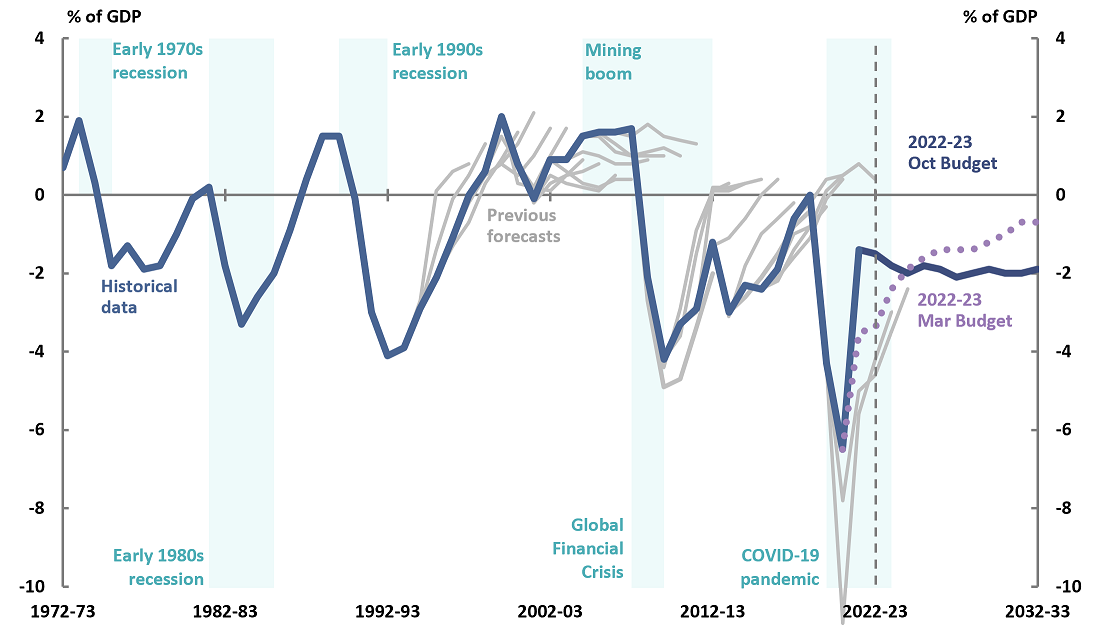
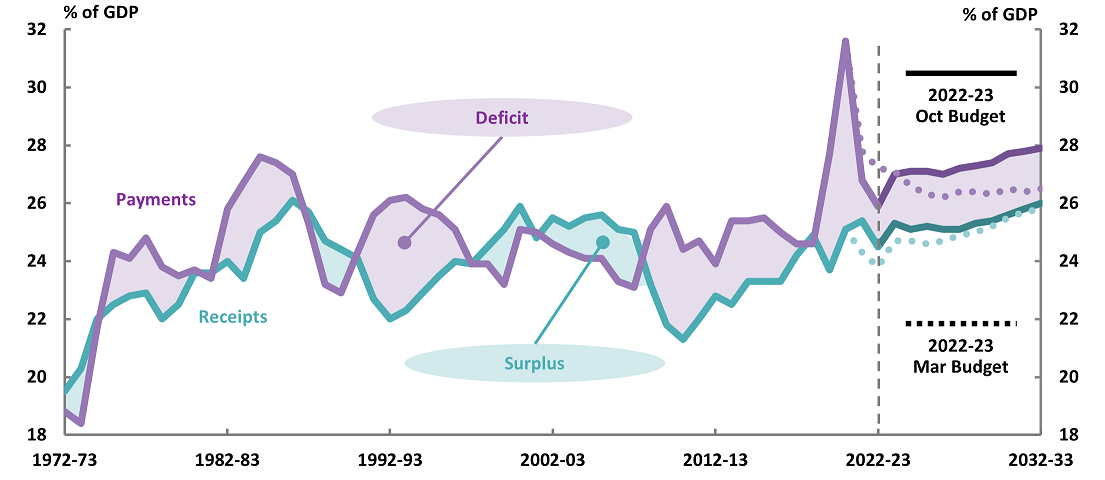
Figure 1B: Total payments and receipts2,4
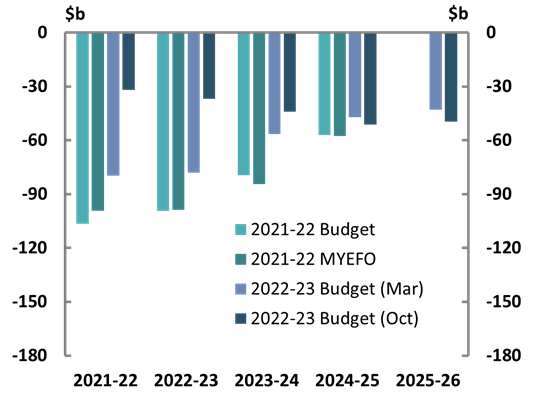
| Figure 2A: Underlying cash balance5 Last four updates |
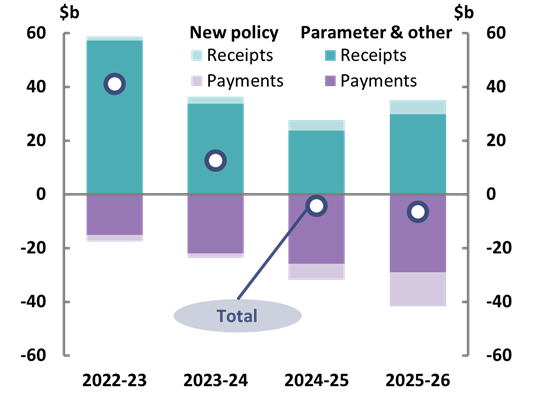
Figure 2B: Change in underlying cash balance since PEFO6 |
 |
 |
| Figure 2C: Net debt2 | Figure 2D: 10-year bond rate2,3 |
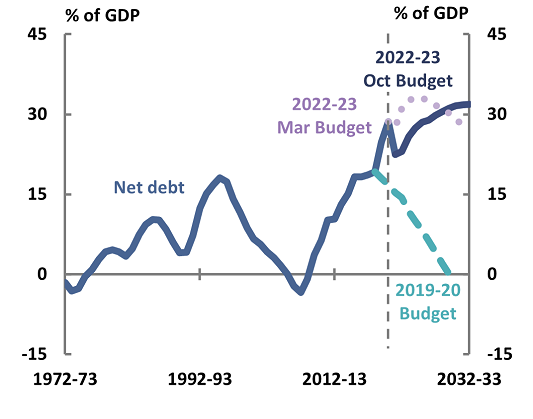 |
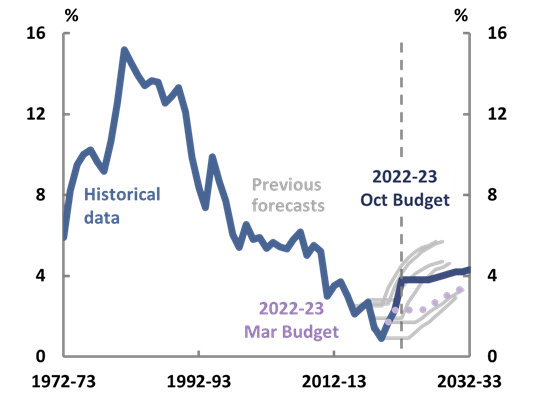 |
| Figure 2E: Interest payments2 | Figure 2F: Net financial worth2,7 |
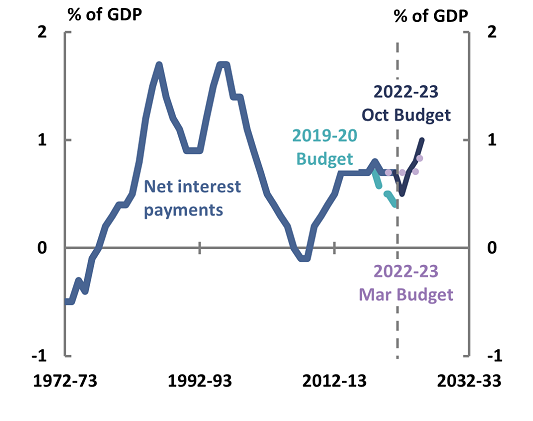 |
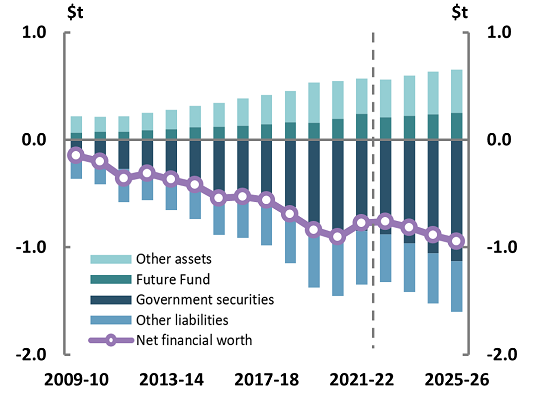 |
Figure 3A: Real GDP growth
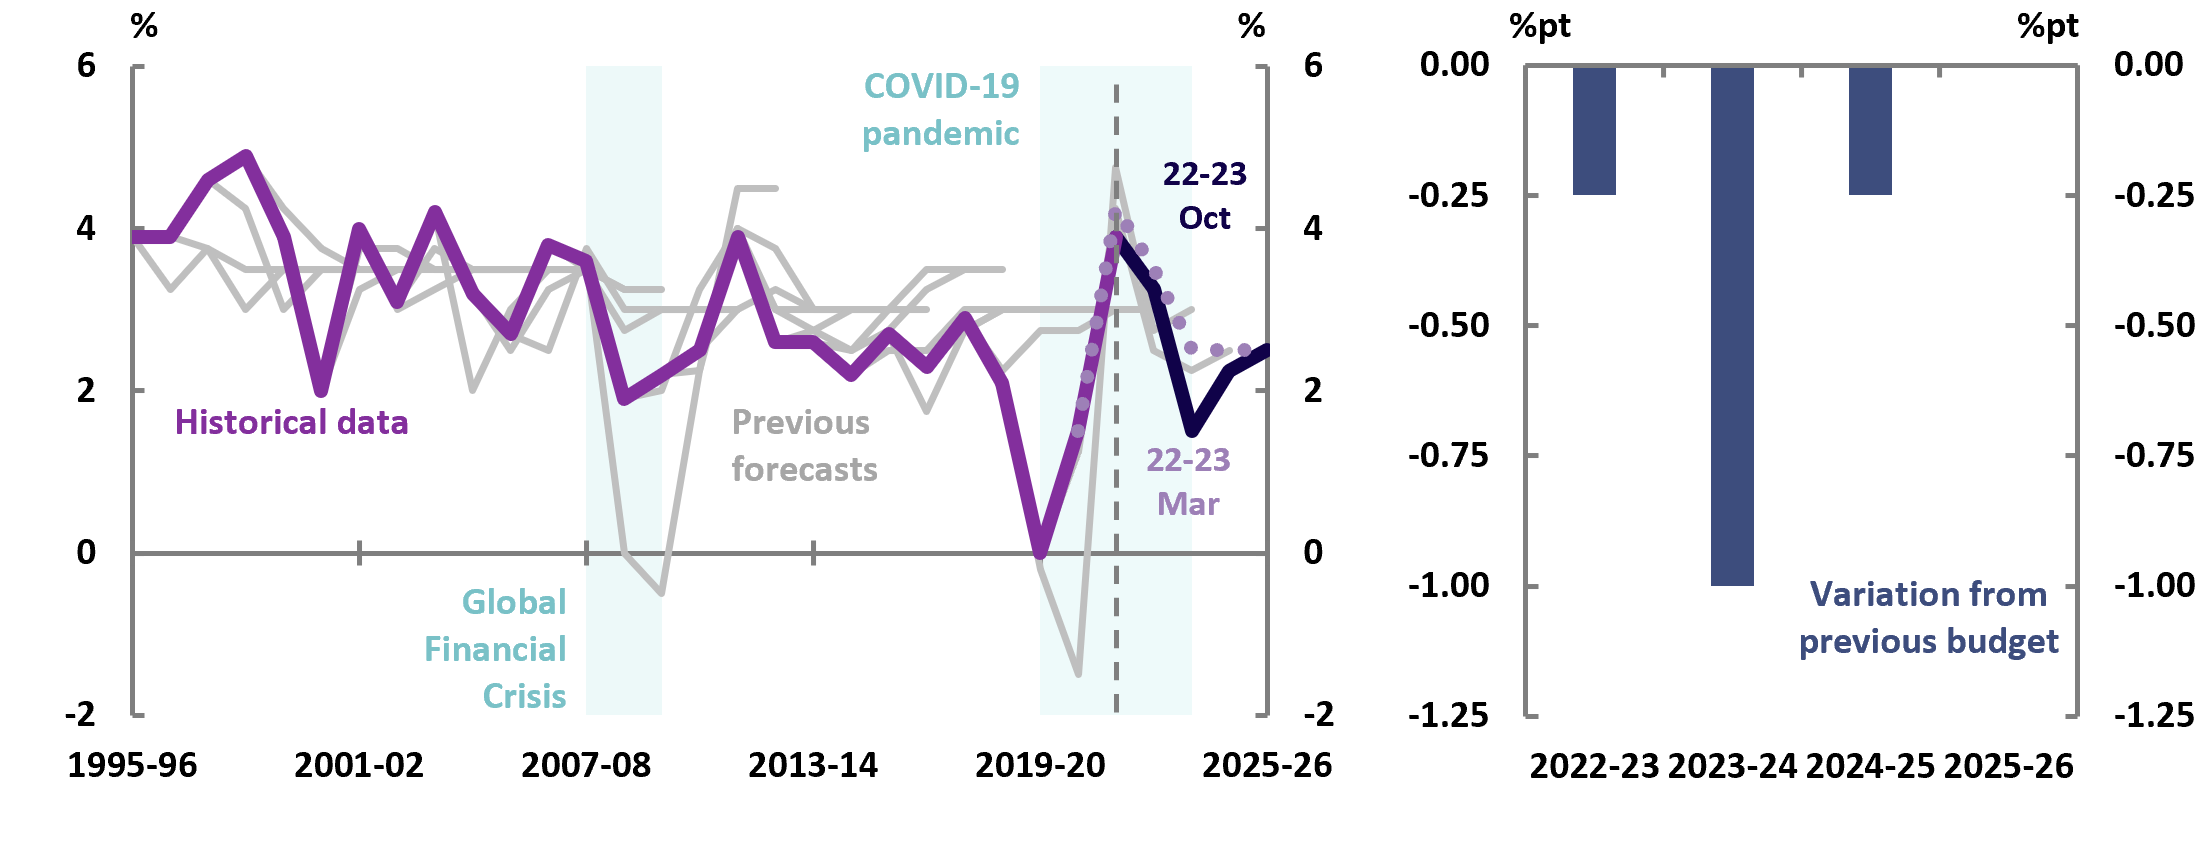
Figure 3B: Consumer Price Index
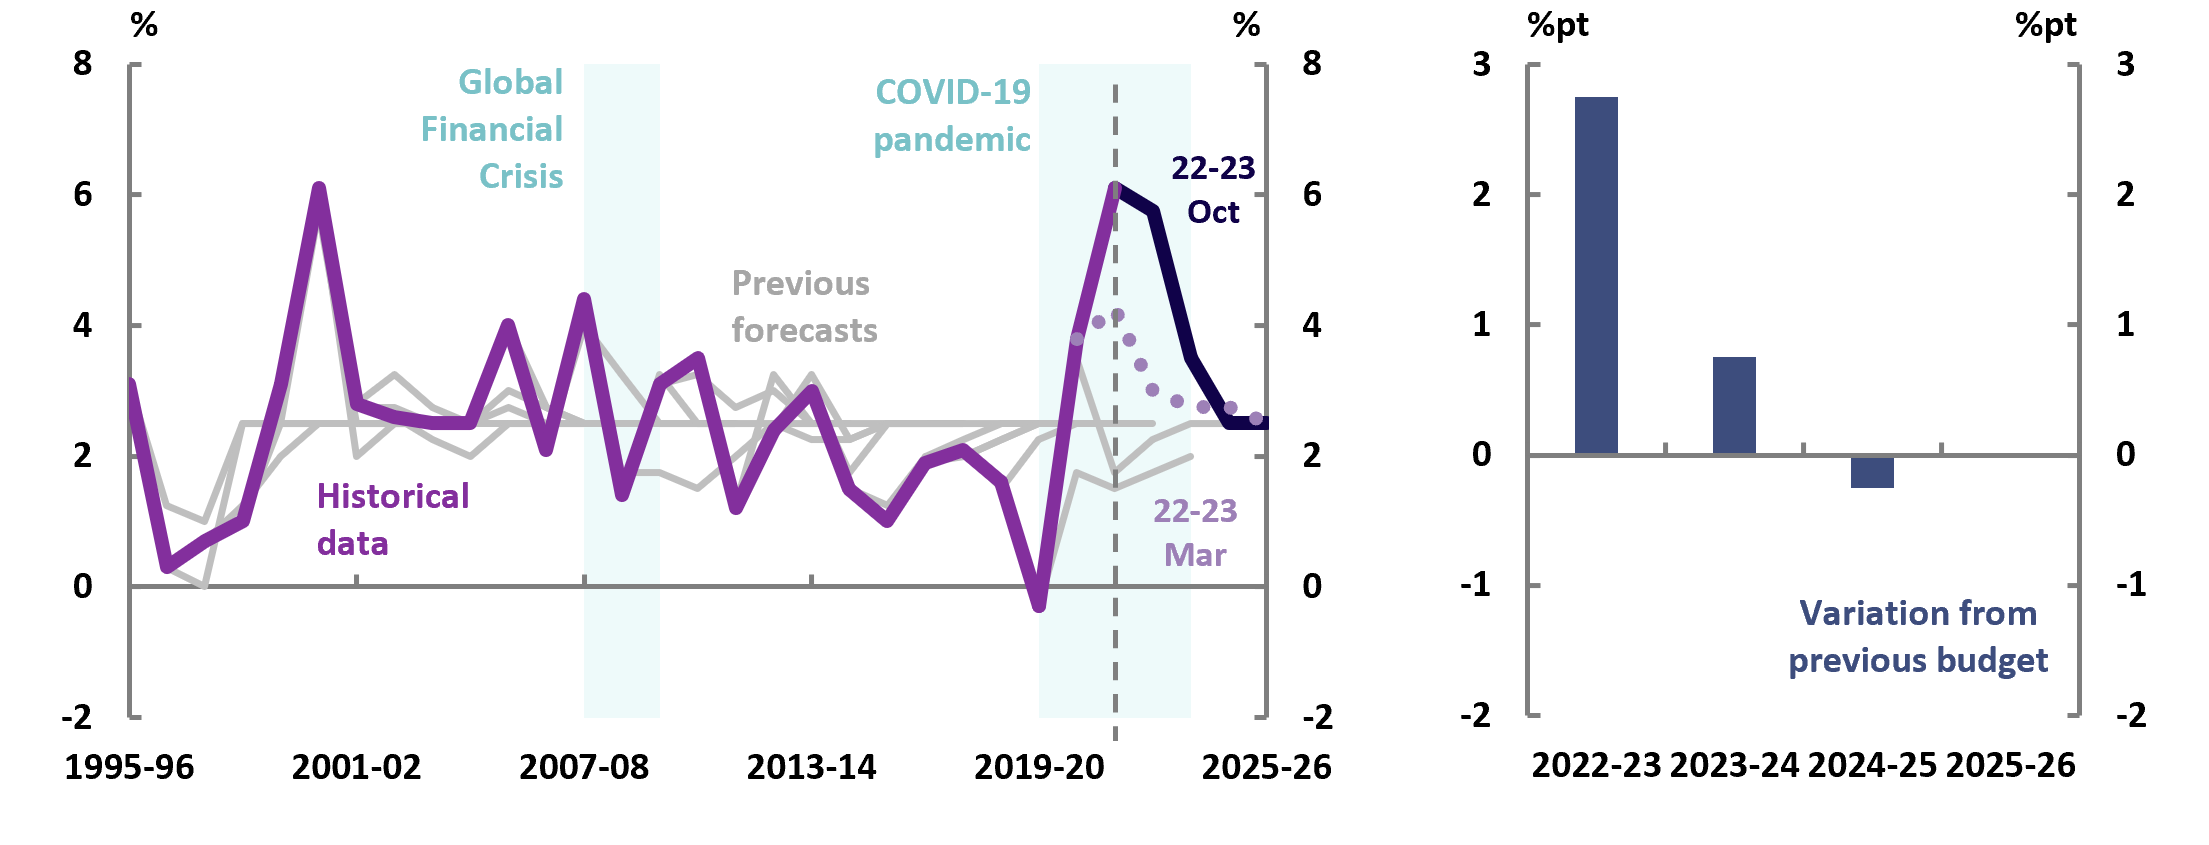
Figure 3C: Wage Price Index
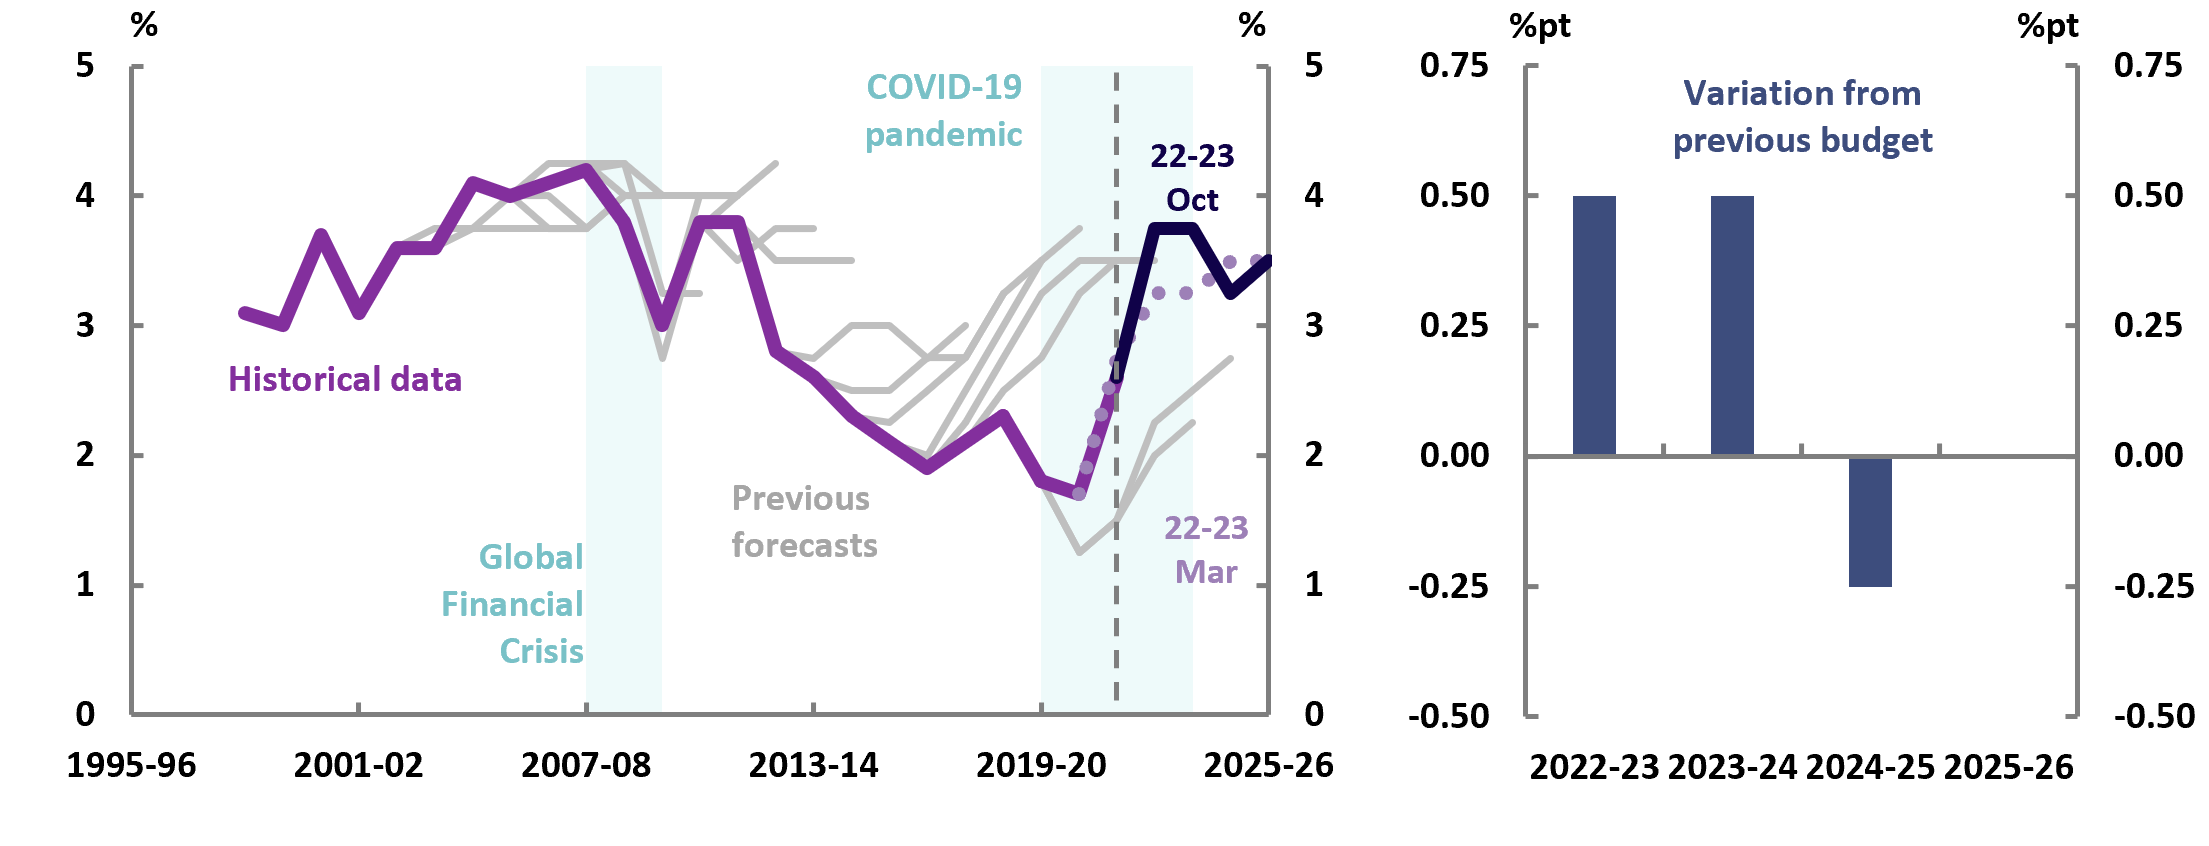
Figure 3D: Nominal GDP growth
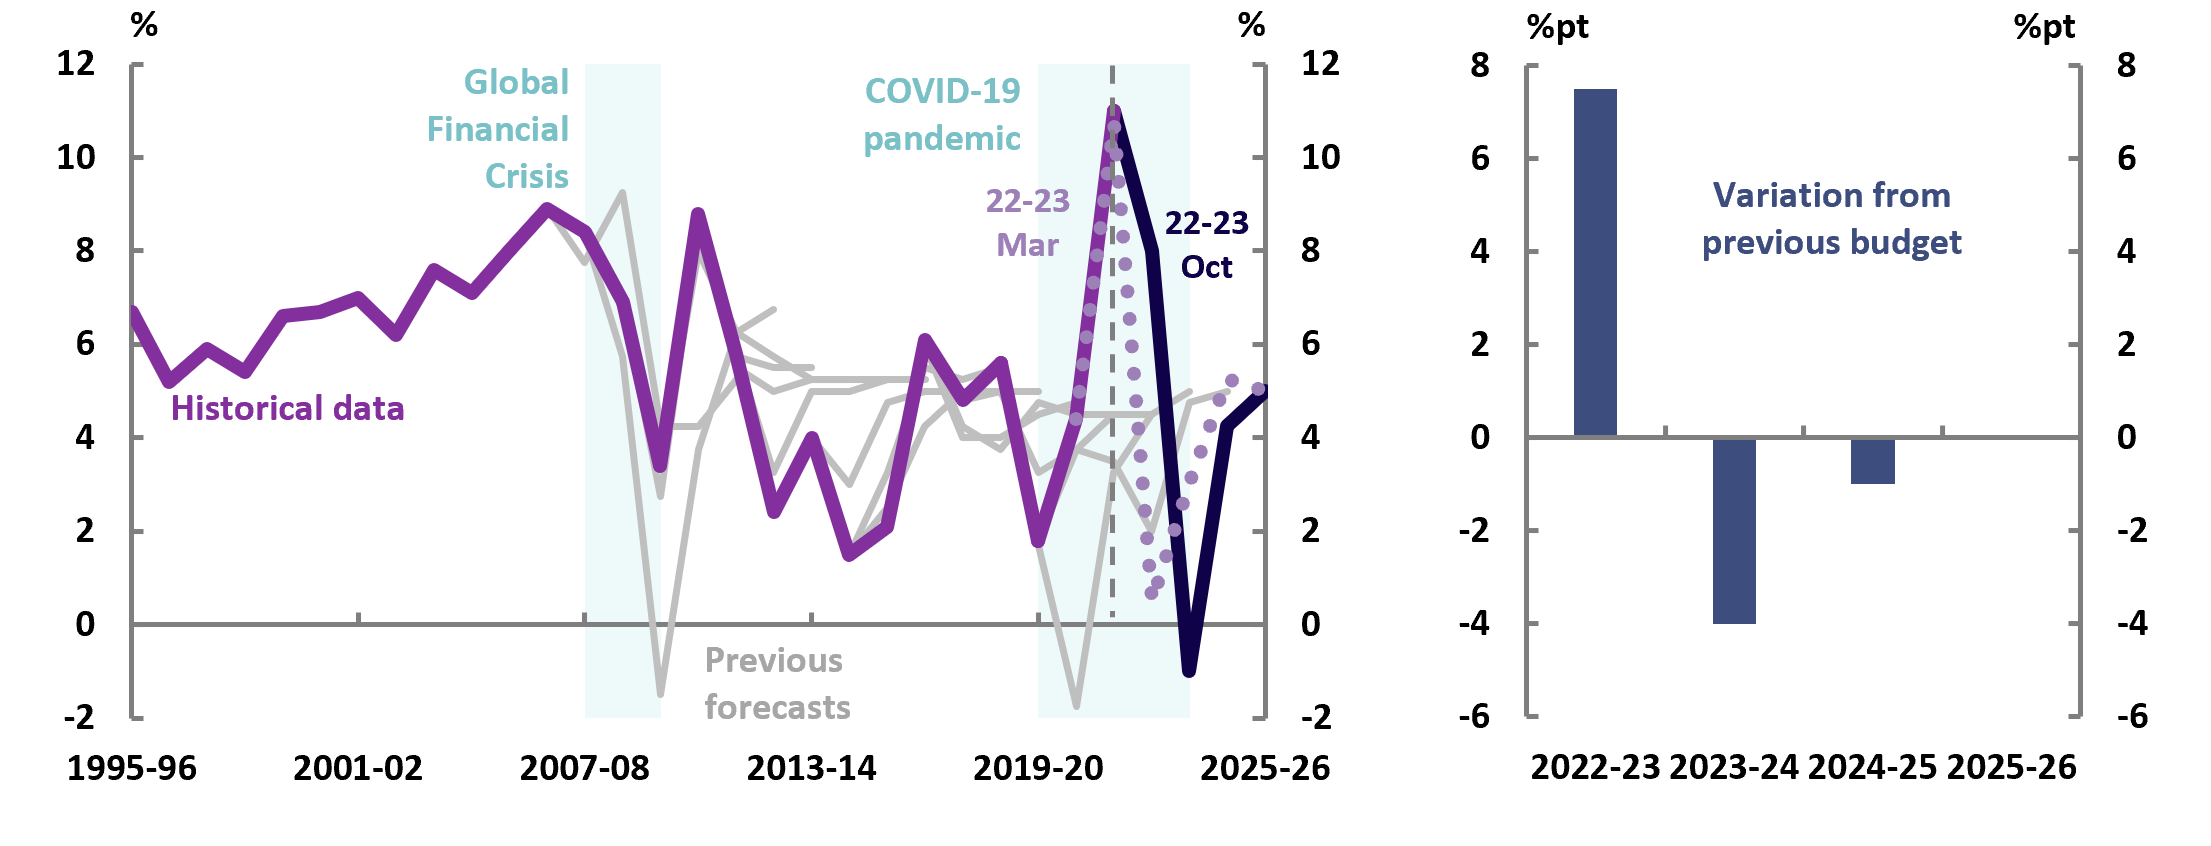
Figure 3E: Unemployment rate

Figure 3F: Employment growth
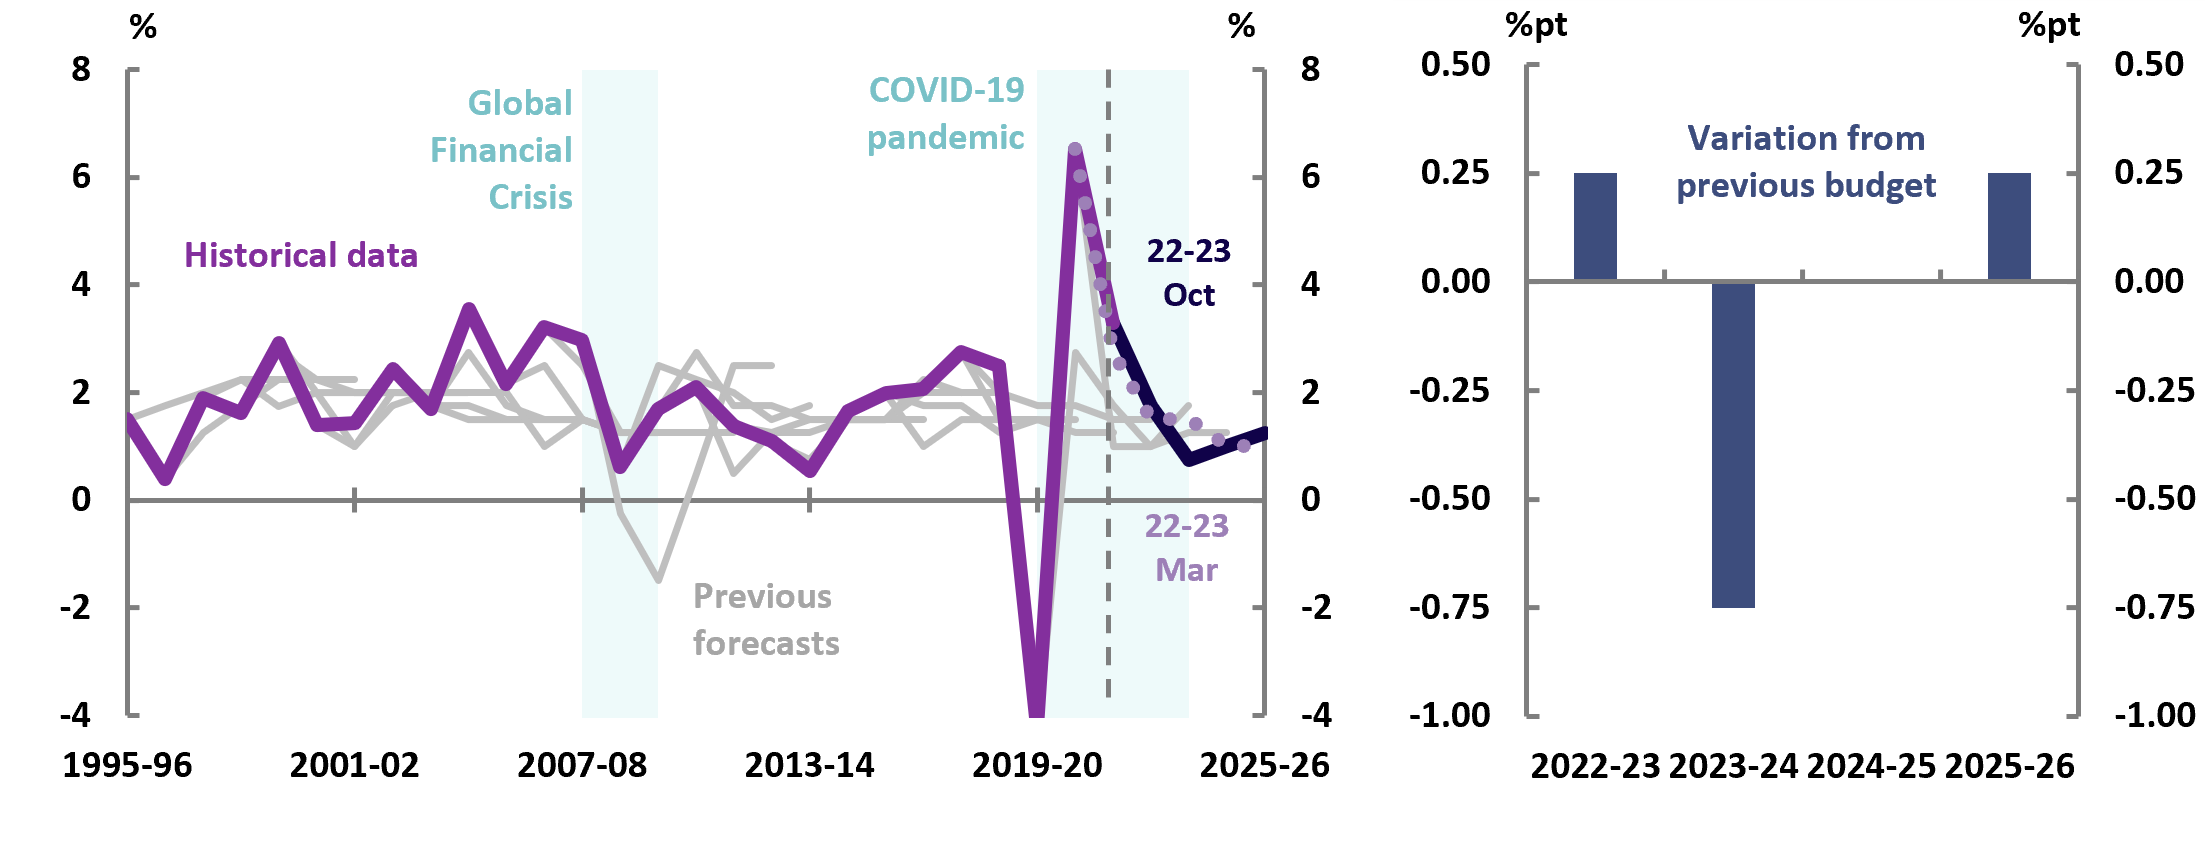
Figure 4A: Sources of revenue in 2022-239
Total revenue: $625b
Figure 4B: Australian Government revenue over time2
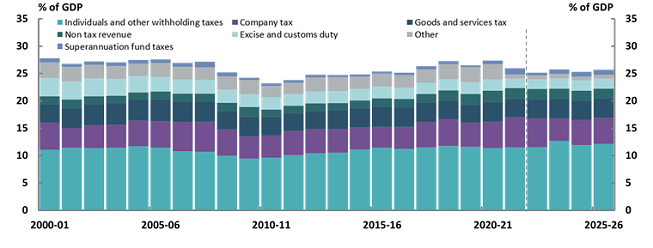
Figure 4C: Top 10 largest measures (2022-23 to 2025-26) ($b)10
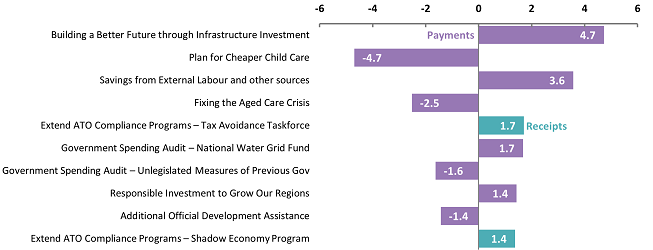
Figure 4D: Top 20 programs in 2022-2311
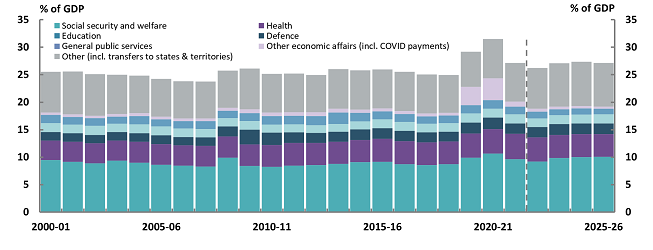
Total expenses: $651b
Figure 4E: Australian Government expenses over time2,12
- Figures are prepared using data contained in the 2022-23 October Budgets, and previous budgets unless otherwise stated. All values prior to and including 2020-21 are outcomes.
- The grey dotted vertical line indicates when forecasts begin.
- Outcomes in history may have been revised since first published. Grey lines represent forecasts in previous budgets.
- Revenue and expenses are on an accrual basis. Receipts and payments are on a cash basis.
- The 2021-22 Budget and MYEFO forecasts end in 2024-25, and the 2022-23 Budget forecasts end in 2025-26.
- Chart shows changes from the Pre-election Fiscal Outlook (PEFO). Parameter and other variations are any changes to the finances of the Commonwealth that are not due to new policy decisions. These primarily include revised economic forecasts, revisions to a program’s estimated costs, and re-profiling of expenditure.
- All values between 2009-10 and 2020-21 reflect those reported in their respective Final Budget Outcomes, and do not incorporate any subsequent revisions. Future Fund asset value estimates are those reported by the Future Fund Management Agency in its 2022-23 Portfolio Budget Statement.
- Real GDP and nominal GDP are percentage change on preceding year. The consumer price index, employment, and the wage price index are through the year growth to the June quarter. The unemployment rate is for the June quarter.
- ‘Other’ includes interest and dividend income, sales of goods and services, and various other revenue items. Values may not sum to totals due to rounding.
- Measure titles have been abbreviated in some cases. A positive number indicates an increase in receipts or a decrease in payments. A negative number indicates a decrease in receipts or an increase in payments. Numbers are net across the Forward Estimates.
- The functions classification separates government expenditure according to the general purpose for which the funds are used. Programs are determined by government and typically aim to deliver specific benefits, services or welfare payments to individuals, businesses, or communities. Programs will often align with functions but may also be cross-cutting. Revenue assistance to states and territories includes GST, transitional GST top-up payments and some other payments (primarily for royalties). Values may not sum to totals due to rounding.
- ‘Other’ includes other purposes, transport and communication, fuel and energy, housing and community amenities, public order and safety, and various other expense items.
See the glossary, for more detail about the terms used in this publication.