Overview
The Medicare Benefits Schedule (MBS) provides universal access to government subsidised health services. It accounts for almost one third of Australian Government health spending and around 5 per cent of total expenditure by the Australian Government ($20.2 billion in 2014–15).
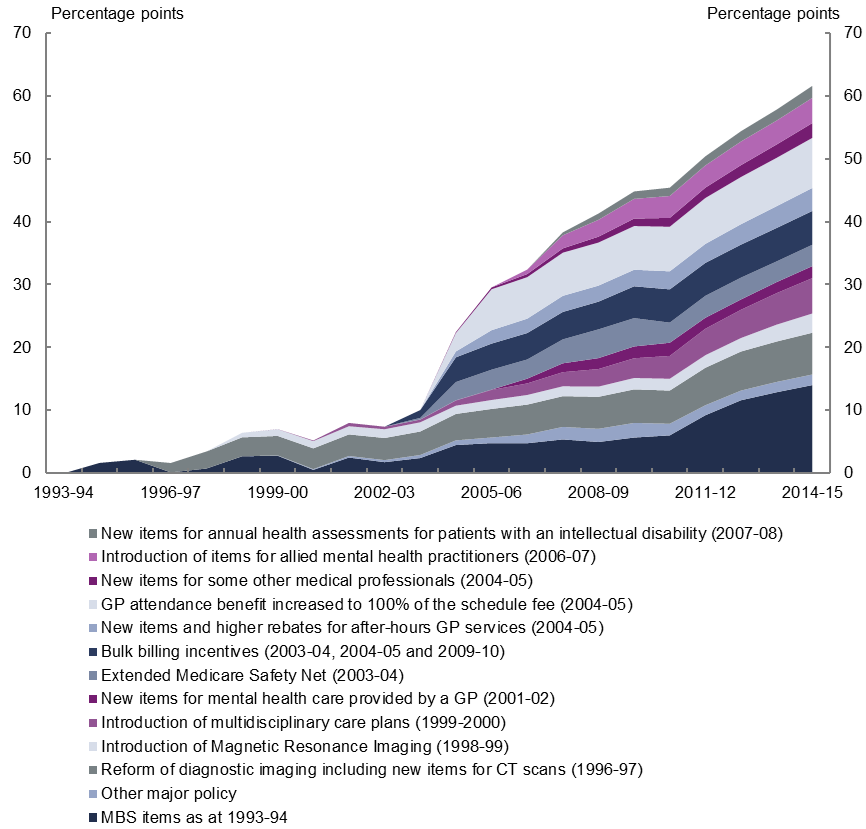
MBS spending per person has grown in real terms by more than 60 per cent, or 2.3 per cent annually, over the past two decades, significantly outstripping the real growth in total government spending per person (1.8 per cent annually). More than three quarters of this growth occurred over the past decade, due mainly to major policy changes that broadened the scope of the MBS or increased the benefits payable for existing services (Figure 1).
The remaining growth occurred in those MBS services that were in place before 1993–94, in particular due to increased utilisation of existing pathology, diagnostic and surgical services.
Figure 1: Cumulative real growth in spending per person on the Medicare Benefits Schedule

The major policy changes that drove the increased growth in MBS spending per person over the past decade largely impacted three broad service areas: general practitioners (GPs); allied health; and pathology and diagnostics. In addition, the introduction of the Extended Medicare Safety Net (EMSN) in 2003–04 contributed to the growth in spending on a number of MBS services.
General practitioners
The major drivers of the growth in spending on the MBS over the past decade were policy changes affecting GP services which contributed 44 per cent of the real growth in per person spending on the MBS over this period.
The increase in the GP rebate from 85 per cent to 100 per cent of the Schedule Fee in 2004–05, leading to higher government benefits being paid for GP services already provided, was the largest contributor to growth.
At the same time, bulk billing incentives for GPs were introduced and services were added for after hours GP care, which significantly increased the number of services accessed by patients. Multidisciplinary care plans also contributed to the acceleration in spending growth through an increase in the number of services accessed by patients.
While decisions to expand the coverage of the MBS and increase MBS benefits were the key contributors to the growth in GP services, other factors also influenced spending growth. Utilisation of GP services was likely influenced by changes in the bulk billing rate which fell between 1993–94 and 2004–05 and then increased following the increase in the GP rebate and the introduction of bulk billing incentives. Variations in the number of GPs due to changes to the rules relating to migrant GPs and the opening of new medical schools also influenced the growth in GP services.
Allied health
Policy changes that extended the coverage of the MBS to certain allied health services contributed 16 per cent of the real growth in per person spending on the MBS over the past decade. In particular, this reflected the inclusion of a wide range of allied health services such as physiotherapy and mental healthcare within the scope of the MBS from 2003–04 onwards.
Pathology and diagnostic services
The addition of diagnostic imaging services to the MBS in the late 1990s, along with the rapid growth in the number of these services accessed by patients, contributed 9 per cent of the real growth in per person spending on the MBS over the past decade.
Also contributing to growth in the number of services was an increase in the number of pathology services accessed by males aged 75 and over during the latter part of the past decade, reflecting a greater focus on chronic disease management and preventative health strategies. This group of older men rapidly increased the number of pathology and diagnostic services they accessed to a level above that of females aged 75 and over by 2014–15.
The rapid growth in the number of pathology and diagnostic services accessed over the past decade was partially offset by a decline in the benefit paid by the government for each service accessed by patients. Funding agreements between the government and the pathology and diagnostic industries capped growth in outlays on these services. Unlike other MBS services, pathology and diagnostic benefit levels have not been indexed since 1998. In addition, technology improvements in the pathology industry allowed significantly more services to be delivered for a given benefit level.
Extended Medicare Safety Net
The introduction of the EMSN in 2003–04 contributed 6 per cent of the real growth in per person spending on the MBS over the past decade.
The EMSN paid 80 per cent of out-of-hospital patient expenses over a set threshold. This meant that benefits were paid even when providers charged substantially more than the government-determined fee for service, that is, the Schedule Fee. The introduction of the EMSN primarily affected surgeries and treatments and specialist services by significantly increasing the benefit paid by the government for these services.
In response, the Government progressively introduced a range of Extended Medicare Safety Net benefit caps from 1 January 2010, which limited the out of pocket expenses the MBS covers for certain services. This resulted in slower growth over the latter part of the past decade.
Projected MBS spending over the next decade
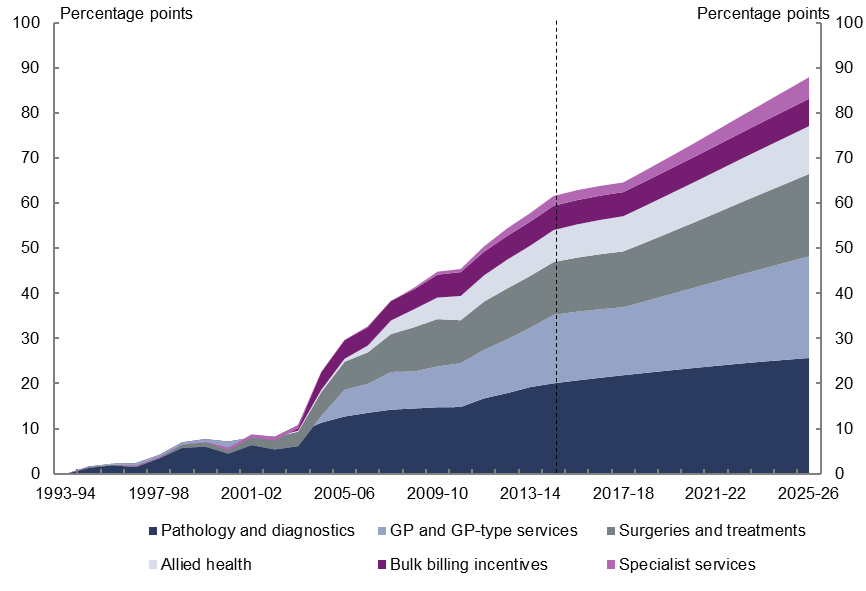
Based on current policy settings, growth in MBS spending per person is projected to slow to 1.4 per cent annually in real terms over the next decade, reaching $36.6 billion in nominal terms by 2025–26. The historical and projected cumulative growth in MBS spending per person by service category is shown in Figure 2.
Figure 2: Cumulative real growth in spending per person on the Medicare Benefits Schedule, by category, actuals and projections

The slower growth in projected spending compared to the past decade is expected to be predominantly driven by the decline in the benefit paid by the government for each service accessed. Following real growth of 0.7 per cent annually over the past decade, the benefit paid for each MBS service is projected to decline in real terms by 0.8 per cent annually over the next decade.
Marginally slower growth in the utilisation of services also contributes to the projected slowdown in spending growth, reflecting the recent slower growth in the utilisation of MBS services added during the past decade.
Growth in spending per person on GP services is projected to slow sharply to 1.2 per cent annually from 3.7 per cent annually over the past decade in real terms, largely due to a slowing in the growth in the benefit paid for each GP service. Strong growth in the benefit paid for each service over the past decade resulted from the one-off impact of the increase in the GP rebate from 85 to 100 per cent in 2004–05. The projected slower growth reflects the combination of the flat growth in the benefit paid since the one-off increase in the GP rebate and government decisions to pause the indexation of GP benefits until 2017–18.
Slightly slower growth in GP attendance rates, largely due to slower growth in attendance rates of males aged 75 and over, which have caught up to equivalent female attendance rates, also contributes marginally to the slowing in spending per person on GP services.
Growth in spending per person on pathology and diagnostics services is projected to slow considerably to 1.0 per cent annually from 2.4 per cent annually over the past decade in real terms. This largely reflects a slowing in growth in the number of pathology and diagnostic services used by males aged 75 and over which have caught up to that of equivalent services used by females over the past decade. The benefit paid per service is expected to continue to decline in real terms consistent with the trend of the past decade.
Growth in spending on allied health services per person is projected to slow to 2.9 per cent annually from 12.7 per cent annually over the past decade in real terms. This slowing in spending growth largely reflects the recent slower growth in the use of these services and, to a lesser degree, the benefit paid by the government for each service accessed.
The impact of ageing on projected growth in MBS spending
As noted earlier, MBS spending per person is projected to grow in real terms by 1.4 per cent from 2014–15 to 2025–26. As discussed in the 2015 Intergenerational Report, this growth will be largely driven by non-demographic factors such as rising income, wage costs in the health sector, changes in disease rates and technological change, which impact on the number of services used by patients and the benefits paid by the government for these services.
The ageing of the population (the increase in the proportion of the population in older age groups) is projected to account for around one third of the annual growth in spending per person between 2014–15 and 2025–26.
Download the full report above.