04 March 2021
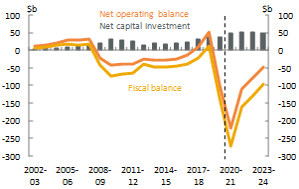
Net operating, fiscal balanceand net capital investment |
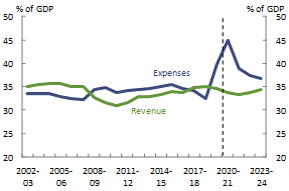
Revenue and expenses |
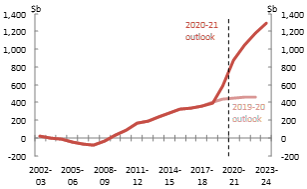
Net debt |
|
|
|
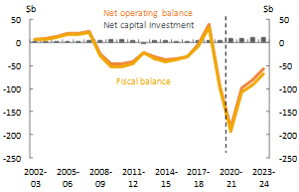
Net operating, fiscal balanceand net capital investment |
Revenue and expenses |
Net debt |
|
|
|
Net operating, fiscal balanceand net capital investment |
Revenue and expenses |
Net debt |
|
|
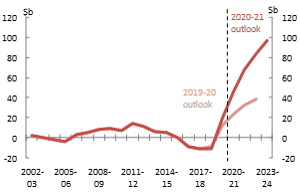
|
Net operating, fiscal balanceand net capital investment |
Revenue and expenses |
Net debt |
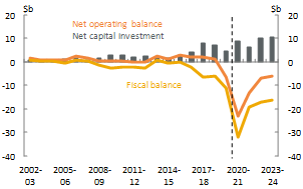
|
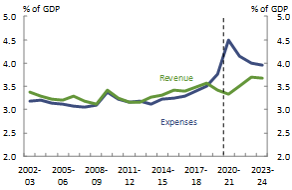
|
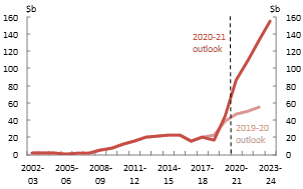
|
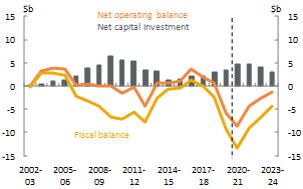
Net operating, fiscal balanceand net capital investment |
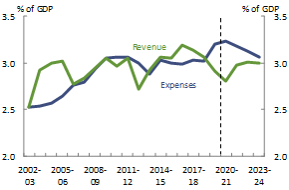
Revenue and expenses |
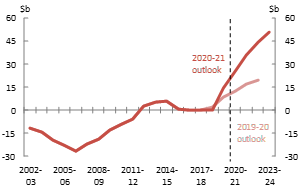
Net debt |
|
|
|
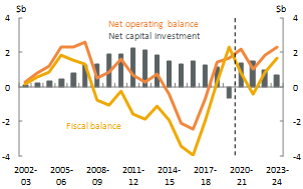
Net operating, fiscal balanceand net capital investment |
Revenue and expenses |
Net debt |
|
|
|
Net operating, fiscal balanceand net capital investment |
Revenue and expenses |
Net debt |
|
|
|
Net operating, fiscal balanceand net capital investment |
Revenue and expenses |
Net debt |
|
|
|
Net operating, fiscal balanceand net capital investment |
Revenue and expenses |
Net debt |
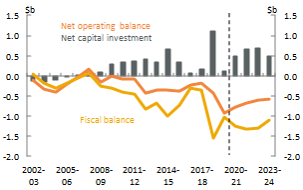
|
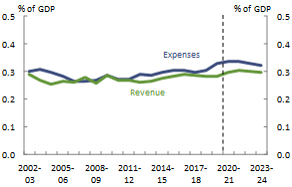
|
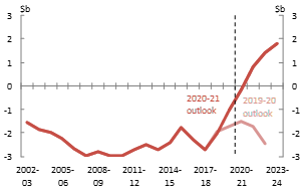
|
Net operating, fiscal balanceand net capital investment |
Revenue and expenses |
Net debt |
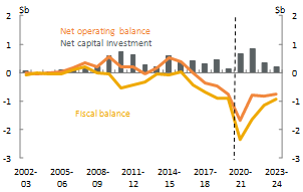
|
|
|
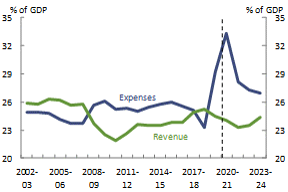
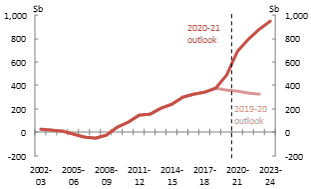
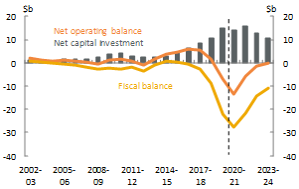
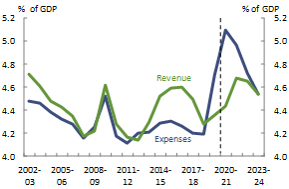
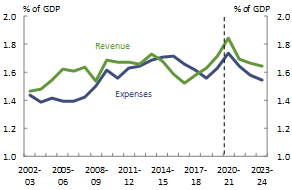
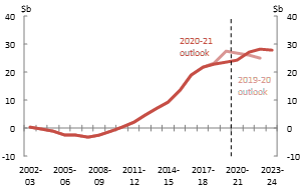
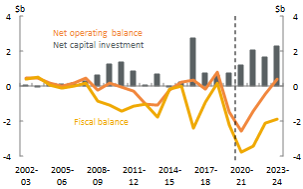
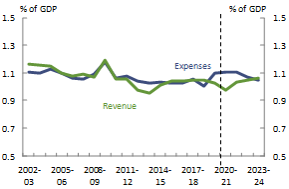
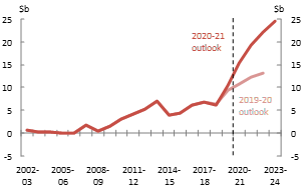
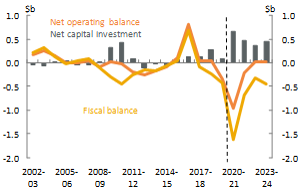
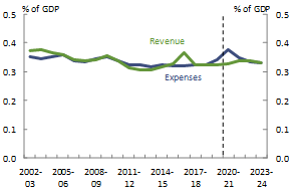
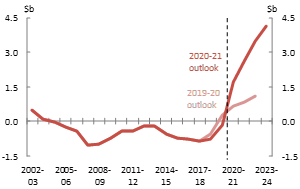
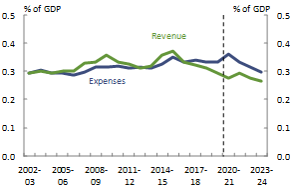
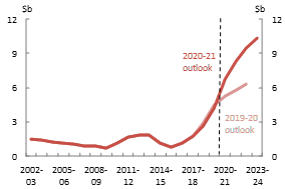
- This snapshot accompanies the PBO’s 2020-21 National Fiscal Outlook report. Data from 2002-03 to 2018-19 are sourced from Australian Bureau of Statistics Government Finance Statistics, Annual. 2019-20 data are sourced from Commonwealth, states and territories 2019-20 final budget outcomes and 2020-21 budget papers and mid-year reports. Forecasts for 2020-21 to 2023-24 are sourced from 2020-21 Commonwealth, state and territory budget papers and mid-year updates. Data are generally comparable over time, but there are some differences in the budget treatment of items across jurisdictions. Further information about data and methods, and a glossary of the budget terms used here, is provided in the technical appendix.
- Net capital investment excludes government businesses.
- The national charts include Commonwealth, state, territory and local governments and eliminate transfers between levels of government to arrive at a consolidated national fiscal position.
- The New South Wales projections of revenue and expenses have been adjusted by the PBO to improve comparability over time and across jurisdictions.
- The Western Australian projections of revenue and expenses have been adjusted by the PBO to improve comparability over time and across jurisdictions.
Supporting material
National fiscal outlook: As at 2020–21 mid-year fiscal updates
The annual report (full version) provides a national perspective on the fiscal outlook by examining outcomes across all levels of Australian government.