|
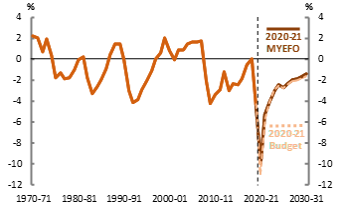
Figure 1: Underlying cash balance2 |
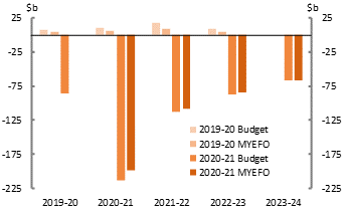
Figure 2: Underlying cash balance |
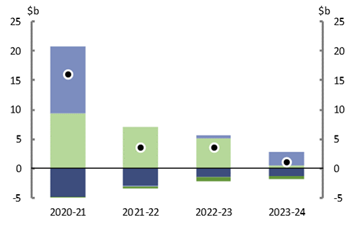
Figure 3: Decomposition of change in underlying cash balance3 |
|
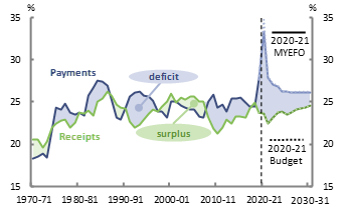
Figure 4: Total payments and receipts24 |
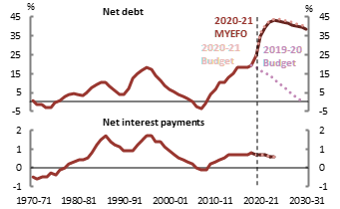
Figure 5: Net debt and net interest payments2 |
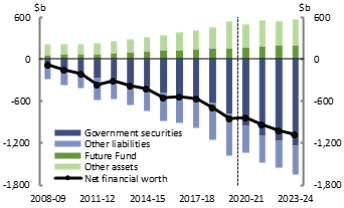
Figure 6: Components of net financial worth25 |
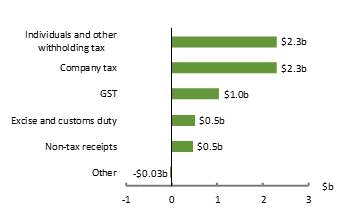
|
Figure 7: Key economic parameters: last four updates |
||
|
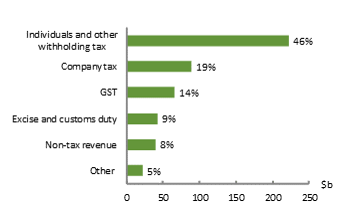
Figure 8: Composition of revenue in 2020-21, $486b7,8 |
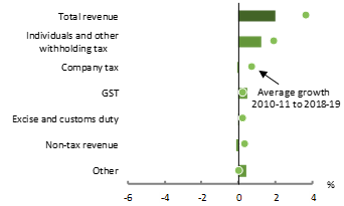
Figure 9: Contributions to annual real growth in revenue8,9 |
Figure 10: Revisions to receipts forecasts since 2020-21 Budget8 |
|
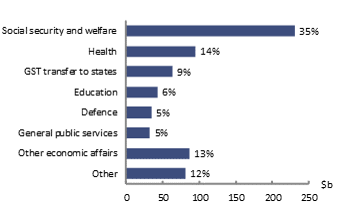
Figure 11: Composition of expenses in 2020-21, $667b7,10 |
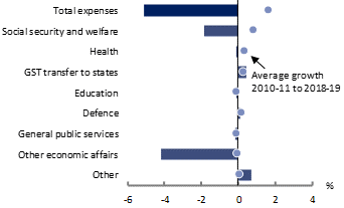
Figure 12: Contributions to annual real growth in expenses10,11,12 |
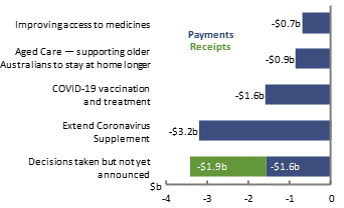
Figure 13: Largest measures13,14 |
- Figures are prepared using data contained in the 2020-21 Mid-Year Economic and Fiscal Outlook (MYEFO), 2020-21 Budget, 2019-20 MYEFO, 2019-20 Budget and Final Budget Outcomes. Any changes shown are since the 2020-21 Budget. For more information about the terms in this snapshot see the Online budget glossary on the PBO website. All values prior to and including 2019-20 are outcomes.
- The black dashed vertical line indicates the last actual data point in the 2020-21 MYEFO.
- Parameter and other variations refer to changes due to a broad range of reasons other than new policy announcements, including revised economic forecasts, revisions to a program’s estimated costs, and re-profiling of expenditure.
- Payments and receipts are on a cash basis.
- Future Fund asset values are those reported by the Future Fund Management Agency in their 2020-21 Portfolio Budget Statement.
- Real GDP and nominal GDP are percentage change on preceding year. The consumer price index, employment, and the wage price index are through the year growth to the June quarter.
- Figures are on an accrual (fiscal) basis. Percentages may not sum to 100 due to rounding.
- ‘Other’ includes superannuation fund taxes, fringe benefits tax, other taxes, and various other items.
- This figure depicts the percentage point contribution from major heads of revenue to average annual real growth in total revenue from 2020-21 to 2023-24. Average annual real growth in total revenue is presented in the top bar of the figure. Components do not necessarily sum to total due to rounding.
- ‘Other’ includes transport and communication, fuel and energy, public order and safety, housing and community amenities, and various other expense items.
- This figure depicts the percentage point contribution from expenditure on key functions to average annual real growth in total expenses from 2020-21 to 2023-24. Average annual real growth in total expenses is presented in the top bar of the figure. Components do not necessarily sum to total due to rounding.
- Total expenses and general public services exclude government superannuation benefits. This differs from total shown in Figure 11.
- This figure depicts the net underlying cash balance impact of the largest measures in the 2020-21 MYEFO. Figures shown here may not match total policy impact due to provisions made in previous budget updates.
- Measure titles are abbreviated. For full measure titles, please refer to 2020-21 MYEFO.
See the glossary, for more detail about the terms used in this publication.
