27 November 2019
National2
Net operating, fiscal balance and net capital investment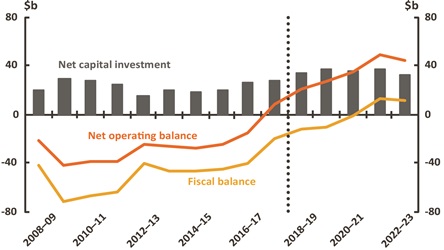
|
Revenue and expenses ‐ real growth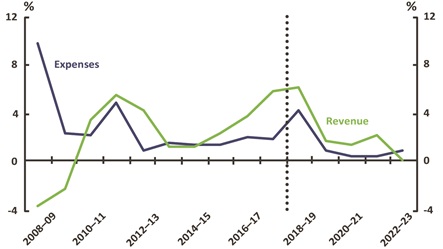
|
Net debt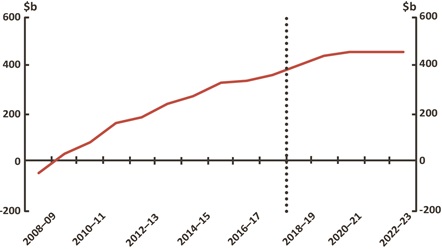
|
Net operating, fiscal balance and net capital investment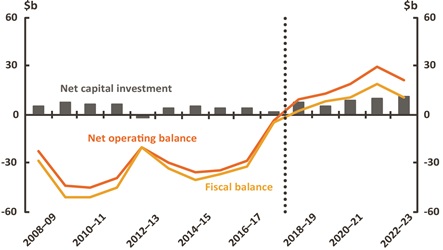
|
Revenue and expenses ‐ real growth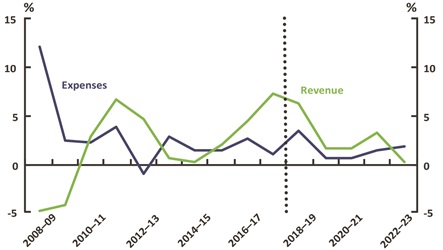
|
Net debt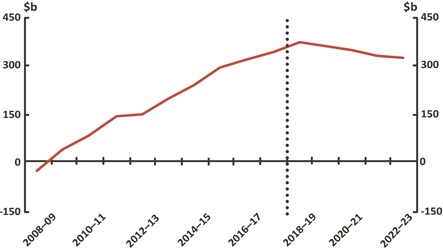
|
New South Wales3
Net operating, fiscal balance and net capital investment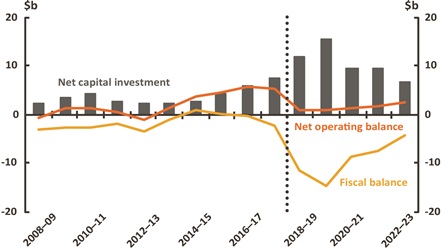
|
Revenue and expenses ‐ real growth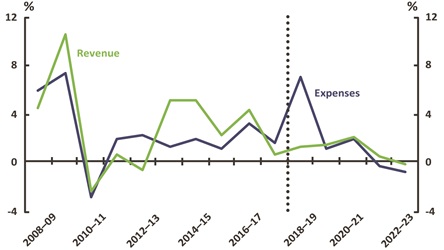
|
Net debt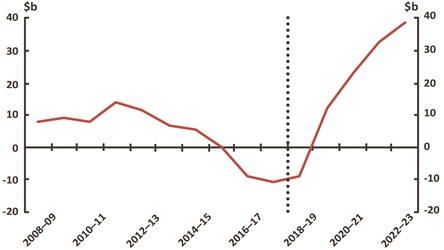
|
Net operating, fiscal balance and net capital investment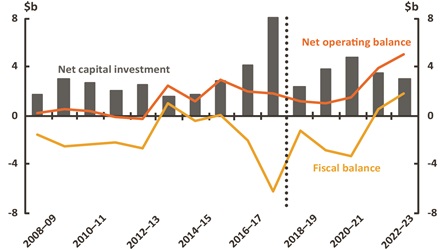
|
Revenue and expenses ‐ real growth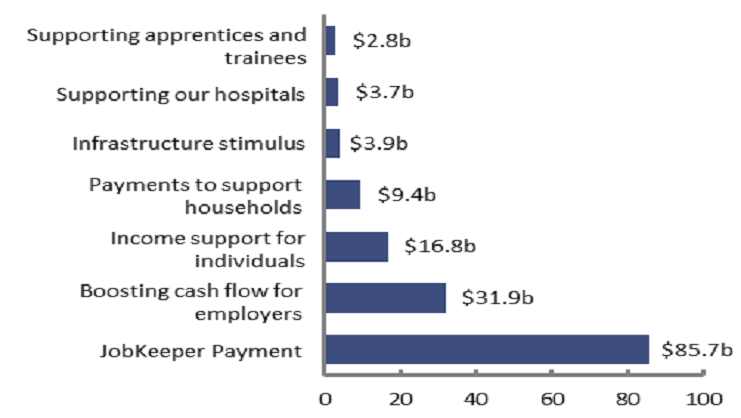
|
Net debt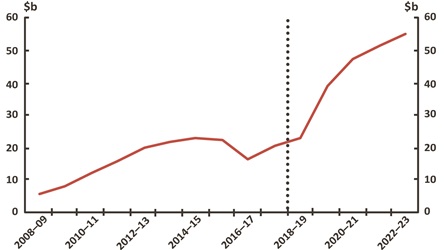
|
Net operating, fiscal balance and net capital investment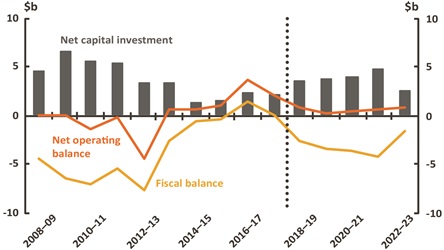
|
Revenue and expenses ‐ real growth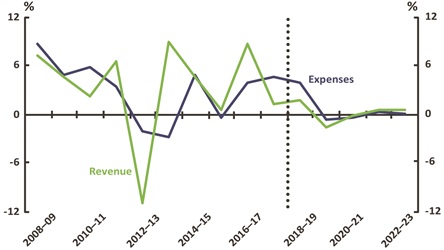
|
Net debt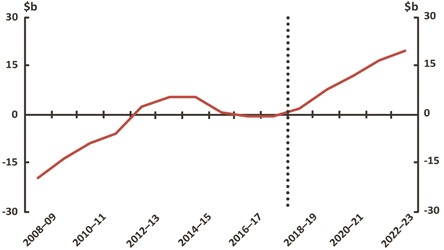
|
Western Australia4
Net operating, fiscal balance and net capital investment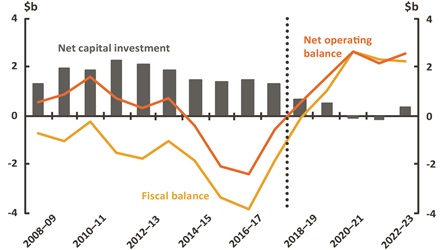
|
Revenue and expenses ‐ real growth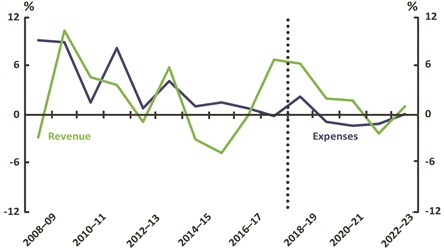
|
Net debt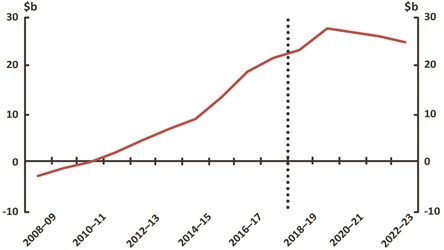
|
Net operating, fiscal balance and net capital investment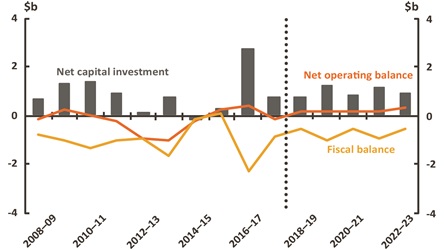
|
Revenue and expenses ‐ real growth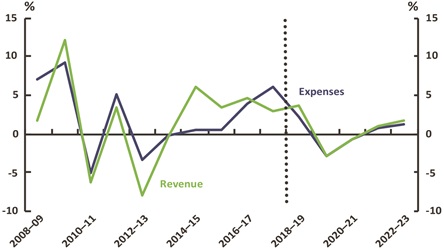
|
Net debt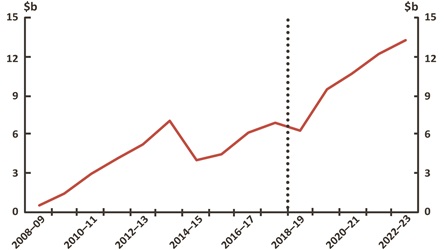
|
Net operating, fiscal balance and net capital investment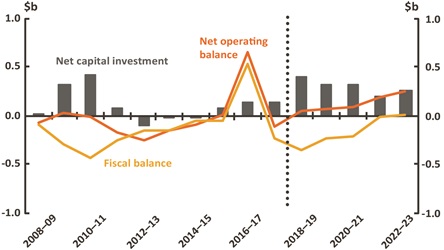
|
Revenue and expenses ‐ real growth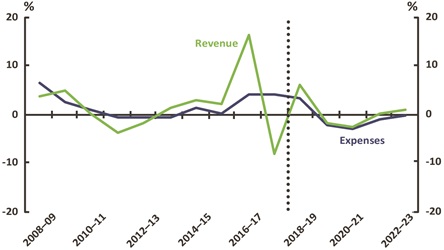
|
Net debt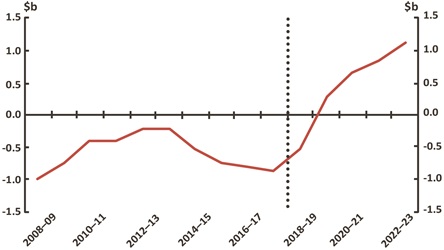
|
Net operating, fiscal balance and net capital investment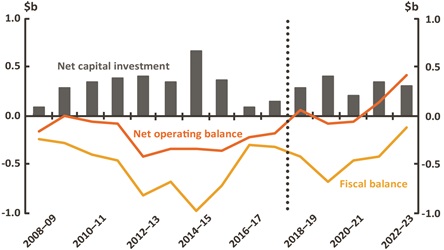
|
Revenue and expenses ‐ real growth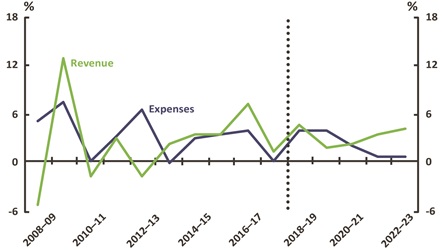
|
Net debt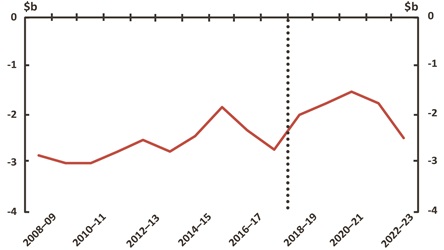
|
Net operating, fiscal balance and net capital investment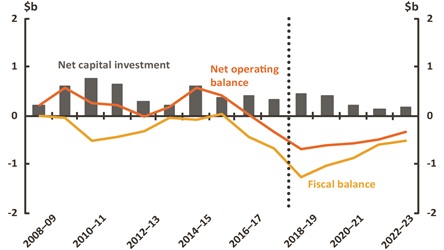
|
Revenue and expenses ‐ real growth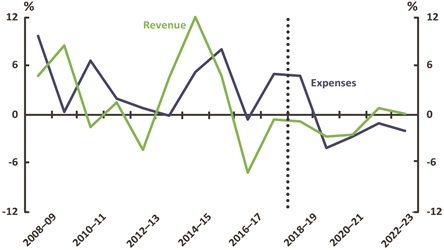
|
Net debt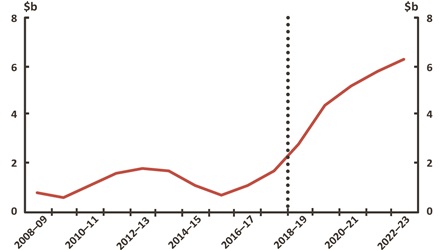
|
- This snapshot accompanies the PBO’s 2019–20 National Fiscal Outlook report. Data from 2008–09 to 2017–18 are sourced from Australian Bureau of Statistics Government Finance Statistics 5512.0. Data from 2018–19 to 2022–23 are sourced from 2019–20 Commonwealth, state and territory budget papers. Data are generally comparable across the two periods, but there are differences in the budget treatment of items across jurisdictions. The data in these charts do not incorporate 2018–19 final budget results of the Commonwealth, states and territories. Further information about data and methods, and a glossary of the budget terms used here, is provided in the report.
- The national charts include Commonwealth, state, territory and local governments and eliminate transfers between levels of government to arrive at a consolidated national fiscal position.
- The New South Wales projections of revenue and expenses have been adjusted by the PBO to improve comparability across periods.
- The Western Australian projections of revenue and expenses have been adjusted by the PBO to improve comparability across periods.
Supporting material
National fiscal outlook: As at 2019-20 Budgets
The annual report (full version) provides a national perspective on the fiscal outlook by examining outcomes across all levels of Australian government.